
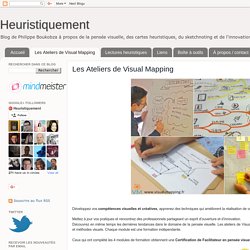
Mika sur Twitter : "Mélange des couleurs et des techniques dans un nouvel atelier de #visualmappingMadrid avec @heuristiquement #onavance. Series & Concept: Mark Lombardi. Isabelle Pailleau on Twitter: "Sketchnoting maxi kiff #visualmappingParis □... Philippe Boukobza sur Twitter : "Grand merci aux participants de #visualmappingParis,les prochains en octobre: La Mie Câline forme ses équipes au Mind Mapping. Accueil Meilleure mémorisation, gain de temps, organisation du travail plus efficace...
Le Mind Mapping est de plus en plus plébiscité par les entreprises. Retour d’expérience de La Mie Câline.(...) Cet article est réservé aux abonnés, pour en profiter abonnez-vous. Et aussi sur les Echos Les articles à la une Europe Sept questions sur un « défaut » grec La crainte d’un défaut de paiement grec se précise à mesure que le blocage entre Athènes et ses créanciers se radicalise. Audrey Akoun on Twitter: "#visualmappingParis avec le boss @heuristiquement le kif intégral... The Grove—Context Map Demo.
Visual Mapping sur Twitter : "Las notas visuales de @Lailama1 en el taller de ##VisualMappingMadrid... Rcopete sur Twitter : "#Storyboard #visualthinking #stoytelling @waltermaes @Lailama1 @ibermapping... Philippe Boukobza sur Twitter : "Graphic recording à l'atelier de ##visualmappingParis... Philippe Boukobza sur Twitter : "Superbe sketch note à l'atelier de ##visualmappingParis... AnneMuriel Leonhardt sur Twitter : "Création aux ateliers #visualmappingParis @ExecoFrance... Philippe Boukobza sur Twitter : "Belle mindmap aujourd'hui pendant l'atelier de #visualmappingParis... Philippe Boukobza sur Twitter : "Travail sur les métaphores visuelles #visualmappingParis...
Philippe Boukobza sur Twitter : "Prise de note visuelle à l'atelier #visualmappingParis... Rue89 - A la Une sur Twitter : "De la datavisualisation dessinée à la main... Philippe Boukobza on Twitter: "Gracias a todos por el taller de #VisualMappingMadrid B1 de ayer! Talleres abiertos de Visual Mapping. Visual Mapping Workshops Actualice sus prácticas, innovando y sorprendiendo a su audiencia: Talleres abiertos de Visual Mapping en Madrid, Barcelona y París.
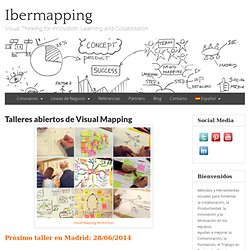
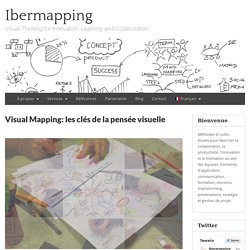
El Visual Mapping conecta las principales técnicas de Visual Thinking. Ayuda a simplificar, estructurar y conectar la información para lograr mejores resultados innovando en tus proyectos. Sus principales áreas de aplicación son el Management, la Formación, el Coaching y la Pedagogía. Les Ateliers de Visual Mapping. Développez vos compétences visuelles et créatives, apprenez des techniques qui améliorent la réalisation de vos projets et votre capacité à communiquer.
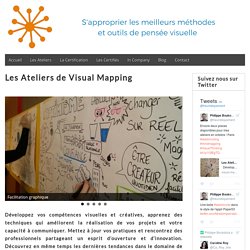
Mettez à jour vos pratiques et rencontrez des professionnels partageant un esprit d’ouverture et d’innovation. Découvrez en même temps les dernières tendances dans le domaine de la pensée visuelle. Un petit exercice de Mind-Concept Mapping. Voici un petit exercice qui peut vous suggérer des idées pour muscler votre compétence en « Visual Thinking ».
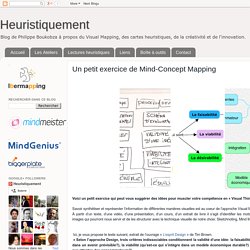
Savoir synthétiser et représenter l’information de différentes manières visuelles est au coeur de l’approche Visual Mapping. À partir d’un texte, d’une vidéo, d’une présentation, d’un cours, d’un extrait de livre il s’agit d’identifier les mots clés, les données essentielles mais aussi les images qui pourront nous servir et de les structurer avec la technique visuelle de notre choix: Sketchnoting, Mind Mapping, Carte Conceptuelle, etc… Ici, je vous propose le texte suivant, extrait de l’ouvrage « L’esprit Design » de Tim Brown. « Selon l’approche Design, trois critères indissociables conditionnent la validité d’une idée: la faisabilité (qu’est-ce qui est fonctionnel et réalisable dans un avenir prévisible?)
, la viabilité (qu’est-ce qui s’intègre dans un modèle économique durable?) Puis une proposition de carte mentales, réalisée avec iThougt HD pour iPad. Choisir un logiciel d'édition de cartes mentales. Philippe Boukobza sur Twitter : "Encore quelques minutes avant le départ de l'atelier de #VisualMappingParis (la suite)... Du trajet au projet. 317 power words that add punch and persuasion to your writing. The key to writing persuasively and compellingly is emotion.
That much Jon Morrow makes clear in his incredible blog post, 317 Power Words That’ll Instantly Make You a Better Writer. To make this comprehensive resource even more accessible, I have converted it into a mind map. To often, our writing fails to capture attention because it lacks emotion. As human beings, we all have “hot buttons” we respond instantly to, such as fear, anger, greed and lust. These emotions are hard-wired into our brains, and play a bigger role in helping us make decisions to a far greater degree than we realize. To help you be a more powerful and persuasive writer, Morrow recommends that you use his list of words as a catalyst to jump-start your thinking. With all seven branches closed, all you see are the primal human emotions. To see a larger version of the mind map, click on the image above right.
To download this mind map in the MindManager .mmap format, please click here. Knowledge Models / Concept Mapping. Knowledge Models / Concept Mapping. Heuristiquement : Merci à ceux qui ont participé... Ateliers de Visual Mapping. Mettez à jour vos pratiques, clarifiez vos projets personnels, innovez et surprenez vos interlocuteurs en apprenant un nouveau langage visuel.
Dans une ambiance ouverte et collaborative, venez apprendre à dominer les meilleures techniques visuelles, complémentaires entre-elles, incluant le mind mapping, le sketchnoting, la pensée design, le story board etc… et découvrir les ressources associées pour aller plus loin. Si vous êtes intéressés, remplissez notre formulaire ci-dessous nous permettra de vous faire parvenir le programme et les informations pratiques.
Merci de nous indiquer par quels niveaux vous êtes interessés A, B ou les deux. Quelques semaines après les ateliers vous pouvez passer la certification afin de valider et de mettre en valeur vos compétences acquises en pensée visuelle. Complétez ce formulaire pour recevoir les programmes détaillés et les modalités d’inscription. Coup d’œil sur la pensée visuelle. - Version française - Connaissez-vous le « Dessous des cartes » ?
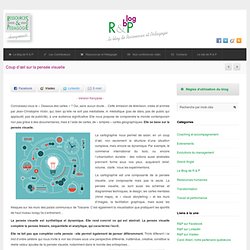
Oui, sans aucun doute… Cette émission de télévision, créée et animée par Jean-Christophe Victor, qui, bien qu’elle ne soit pas médiatisée, ni médiatique (pas de stars, pas de public qui applaudit, pas de publicité), a une audience significative. Elle nous propose de comprendre le monde contemporain non pas grâce à des documentaires, mais à l’aide de cartes, de « simples » cartes géographiques.
Heuristiquement : C'est la pause dėjeuner... Heuristiquement : Dėmarrage des ateliers de... Ateliers de Visual Mapping. Développez vos compétences visuelles et créatives, apprenez des techniques qui améliorent la réalisation de vos projets et votre capacité à communiquer.
Mettez à jour vos pratiques et rencontrez des professionnels partageant un esprit d’ouverture et d’innovation. Découvrez en même temps les dernières tendances dans le domaine de la pensée visuelle. Les ateliers de Visual Mapping constituent un parcours d’apprentissage des outils et méthodes visuels. Chaque module est une formation indépendante. Ceux qui ont complété les 4 modules de formation obtiennent une Certification de Facilitateur en pensée visuelle.
Message Map. Sketchnoting. Mind Mapping. Freemind. Concept Mapping. Make It Visual. Collection: Visual thinking. Pretty pictures: Can images stop data overload? Empahty Map. Now it's time for the group to describe and note what Freddie's personal experience is (empathizing from his point of view) in each of the categories above.
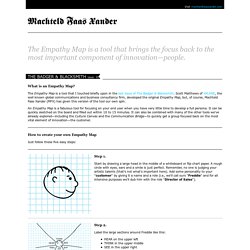
Remember, the context is very important; what he's seeing, hearing, thinking, doing, feeling and saying will be very different, depending on the situation (i.e. say, Freddie wants to sell more product). Spend about three minutes on each section, moving through the sections as a group. You can fill in each section using Post-it® notes or marker, asking: What is Freddie hearing?
Tools. Roots of Visual Mapping. Visual Facilitation. How Does the Brain Retain Information? Online Mindmaps Galleries.