
Philippe
MEASURING LINEAR MOMENTUM ANGLES. "whenperformancecounts" Copyright Ó George M.
Bonnett, J.D. 1997 All rights reserved.
Impact Factor. Autonomous Vehicles Makers Report Disengagement Numbers in California. It’s report card time for the automakers and Silicon Valley denizens studying the tricky problem of making cars drive themselves, and everyone is passing.
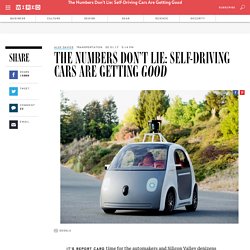
The California DMV just released its annual slate of “disengagement reports,” documents provided by the 11 companies that received state permits to test autonomous vehicles by the end of 2015. The results, summarized below, reveal how often humans had to wrest control away from the computer, and why (sort of). Although the reports are an imperfect measure of how the technology performs, they do reveal rapid progress toward the day when you are no longer needed behind the wheel.
Two spaces after a period: Why you should never, ever do it. Videos. How to read a SOM - viscovery.net. A self-organizing map (SOM) may be the most compact way to represent a data distribution.
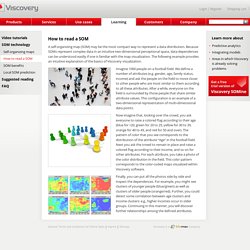
Because SOMs represent complex data in an intuitive two-dimensional perceptional space, data dependences can be understood easiliy if one is familiar with the map visualization. The following example provides an intuitive explanation of the basics of Viscovery visualization. Imagine 1000 people on a football field. We define a number of attributes (e.g. gender, age, family status, income) and ask the people on the field to move closer to other people who are most similar to them according to all these attributes. After a while, everyone on the field is surrounded by those people that share similar attribute values. Now imagine that, looking over the crowd, you ask everyone to raise a colored flag according to their age (blue for <20, green for 20 to 29, yellow for 30 to 39, orange for 40 to 49, and red for 50 and over).
Finally, you can put all the photos side by side and inspect the dependences. The View from the Front Seat of the Google Self-Driving Car — Backchannel. After 1.7 million miles we’ve learned a lot — not just about our system but how humans drive, too.
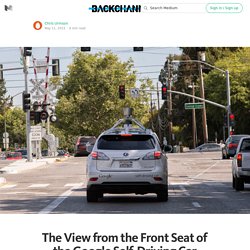
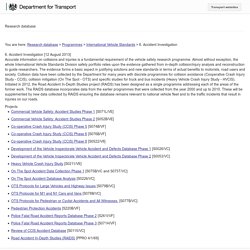
About 33,000 people die on America’s roads every year. Difference Between Tier 1 & Tier 2 Companies. Seoul Korea 7 Day Itinerary and Summary. Website for the decision notifications of papers for the 25th World Road Congress. SafetyNet. SafetyNet is an Integrated Project funded by DG-TREN of the European Commission.
The objective of the project is to build the framework of a European Road Safety Observatory, which will be the primary focus for road safety data and knowledge, as specified in the Road Safety Action Plan 2003. The Observatory will support all aspects of road and vehicle safety policy development at European and national levels. It will make new proposals for common European approaches in several areas including exposure data and Safety Performance Indicators. It will extend the CARE database to incorporate the new EU Member States and will develop new fatal and in-depth accident causation databases. Gibson-Dillard_Section 10.1. How To: Calculate A Chi-Square Test In Excel. DuPage Statistics: Chi-Square Test for Homogeneity of Propo.
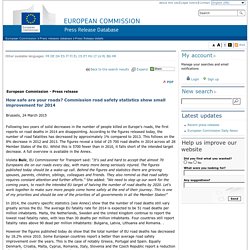
Testing for Statistical Significance in Excel: the Chi-Squared Test. 6. Accident Investigation - Research database - Department for Transport. Transport websites.
Plagiate Finder.
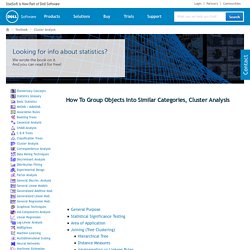
How safe are your roads? Commission road safety statistics show small improvement for 2014. Following two years of solid decreases in the number of people killed on Europe's roads, the first reports on road deaths in 2014 are disappointing.
According to the figures released today, the number of road fatalities has decreased by approximately 1% compared to 2013. This follows on the 8% decrease in 2012 and 2013. The figures reveal a total of 25 700 road deaths in 2014 across all 28 Member States of the EU. Understanding and Interpreting Lux Values. The primary sensor data type for ambient light sensors is illuminance in lux (lumens per square meter).

The principles outlined in this topic are based on taking lux values as input and reacting to that data in a program. Lux readings are directly proportional to the energy per square meter that is absorbed per second. Human perception of light levels is not so straightforward. Human perception of light is complicated because our eyes are constantly adjusting and other biological processes are affecting our perception. Mietvertrag: 3 Monate Kündigungsfrist umgehen ist nur einvernehmlich möglich! How To Group Objects Into Similar Categories, Cluster Analysis. General Purpose The term cluster analysis (first used by Tryon, 1939) encompasses a number of different algorithms and methods for grouping objects of similar kind into respective categories.
A general question facing researchers in many areas of inquiry is how to organize observed data into meaningful structures, that is, to develop taxonomies. TRACE Template.
Postgraduate Funding for University Students through Grants from Charity. RAIDS Database. SHRP2 Data Access. Co-operative Crash Injury Study (CCIS) Phase 8 - Research database - Department for Transport. Reference: S0522/V8 Last update: 16/03/2006 15:38:17 Objectives.

Login required - RAIDS Glossary. Login required - RAIDS Glossary. Cluster Data with a Self-Organizing Map - MATLAB & Simulink - MathWorks France. If needed, open the Neural Network Start GUI with this command: Click Clustering Tool to open the Neural Network Clustering Tool. (You can also use the command nctool.) Click Next. The Select Data window appears. Click Load Example Data Set. The Clustering Data Set Chooser window appears. You can click Simple Script or Advanced Script to create MATLAB® code that can be used to reproduce all of the previous steps from the command line. Chapter2.
Testing and validation of ADS. Safety impacts of ADS. Intersection accidents. Automated driving technologies. Science, health and medical journals, full text articles and books. Academic research and writing. Loughborough. Images.