
Illustrating Flow: Two Methods for Wrangling Big Data. The goal of the set of shipping mix maps, other than to distinguish between the types of shipment, was to try to tease out the de facto shipping lanes in addition to the well defined official shipping lanes.
With one year of data (six million locations) we saw, as you might expect, a lot of activity around ports, a few surprisingly regimented lanes in established paths, and a diaspora of dots that if you squinted enough hinted at some worn paths. In order to make these paths more evident, which was the goal, we used a few methods -I'll tell you about two of the cooler ones. The shipping mix maps try to illustrate practical or unofficial seaways. Extrapolation The data had, in addition to other cool metrics, speed and direction information for each vessel position. An illustration comparing raw locations, which don't give much indication of a travel pattern, to the extrapolated ghost locations based on predicted positions -which help to visually define paths. Speed Weighting. The Product Space and The Wealth of Nations. Where people move in Germany. Polyline creation - How can I map a matrix of origins and destinations in QGIS? Current community your communities Sign up or log in to customize your list. more stack exchange communities Stack Exchange sign up log in tour help Geographic Information Systems Ask Question Take the 2-minute tour × Geographic Information Systems Stack Exchange is a question and answer site for cartographers, geographers and GIS professionals.
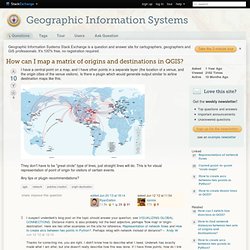
How can I map a matrix of origins and destinations in QGIS? 5 Answers active oldest votes Your Answer Sign up or log in Sign up using Google Sign up using Facebook Sign up using Stack Exchange Post as a guest discard By posting your answer, you agree to the privacy policy and terms of service. Not the answer you're looking for? Get the weekly newsletter! Top questions and answers Important announcements Unanswered questions see an example newsletter By subscribing, you agree to the privacy policy and terms of service. Linked. HTML5: Flow map of internal migration in England & Wales. At the start of this year, I wrote a brief post on how we’ve been looking closely at the emergence of HTML5 as a visualisation platform.
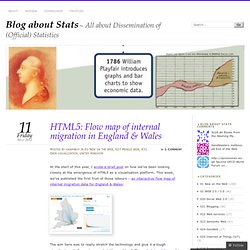
This week, we’ve published the first fruit of those labours – an interactive flow map of internal migration data for England & Wales: The aim here was to really stretch the technology and give it a tough visualisation challenge to see what it’s capable of. The underlying data used in the map contains over 60,000 migration flows – yet we have still managed to produce an interactive application that will run on an iPhone. I will aim to write some more details later on the development process and the good and bad experiences of transitioning from a platform like Flash. But the majority of solutions to our problems came from a general realisation that HTML5 doesn’t really exist at all, but is more an amorphous mixture of inter-related technologies and javascript libraries that are becoming increasingly cohesive as a development platform.
Like this: Migration Map HTML5. Migrations Map: Where are migrants coming from? Where have migrants left? Peoplemovin - A visualization of migration flows. Madewulf/MigrationsMap.net.