
[D] Why aren’t Gamma GLMs used more often? : statistics. To transform or not to transform: using generalized linear mixed models to analyse reaction time data. Introduction A central theme of this special issue is how the uncritical use of statistical procedures in psychological research can lead researchers to draw incorrect theoretical and practical conclusions.
From a procedure as simple as averaging over a set of data points, Speelman and McGann (2013) elaborated how the resulting value is often used to draw conclusions that violate many theoretical positions describing individual, or even moment to moment, volatility in human cognitive systems. Similarly, Trafimow (2014) expressed concern over the use of statistical techniques like related-samples t-tests, which appropriately assess differences between individuals (e.g., do changes in attitudes differ across people on average because of variable X), but are ubiquitously used inappropriately to address hypotheses formulated within each individual (e.g., does variable X cause a particular person's attitude to differ).
To Transform or Not to Transform? The Fixed Factors The Random Factors. Social Research Methods - Knowledge Base - General Linear Model. « PreviousHomeNext » The General Linear Model (GLM) underlies most of the statistical analyses that are used in applied and social research.
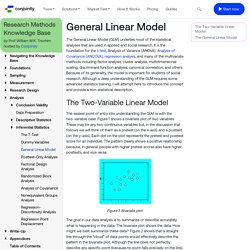
It is the foundation for the t-test, Analysis of Variance (ANOVA), Analysis of Covariance (ANCOVA), regression analysis, and many of the multivariate methods including factor analysis, cluster analysis, multidimensional scaling, discriminant function analysis, canonical correlation, and others. Because of its generality, the model is important for students of social research. Although a deep understanding of the GLM requires some advanced statistics training, I will attempt here to introduce the concept and provide a non-statistical description.
General Linear Models (GLM) The General Linear Model (GLM) BrainVoyager v20.6 The described t test for assessing the difference of two mean values is a special case of an analysis of a qualitative (categorical) independent variable.
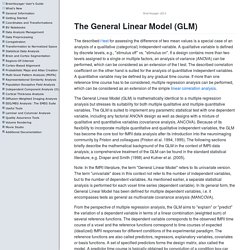
A qualitative variable is defined by discrete levels, e.g., "stimulus off" vs. "stimulus on". If a design contains more than two levels assigned to a single or multiple factors, an analysis of variance (ANOVA) can be performed, which can be considered as an extension of the t test. The described correlation coefficient on the other hand is suited for the analysis of quantitative independent variables. The General Linear Model (GLM) is mathematically identical to a multiple regression analysis but stresses its suitability for both multiple qualitative and multiple quantitative variables. Note: In the fMRI literature, the term "General Linear Model" refers to its univariate version.
The y variable on the left side corresponds to the data, i.e. the measured time course of a single voxel. Self study - How are regression, the t-test, and the ANOVA all versions of the general linear model? Common statistical tests are linear models (or: how to teach stats) By Jonas Kristoffer Lindeløv (blog, profile). Last updated: 28 June, 2019 (See changelog). Check out the Python version and the Twitter summary. This document is summarised in the table below. It shows the linear models underlying common parametric and “non-parametric” tests. Formulating all the tests in the same language highlights the many similarities between them. Pearson's chi-square statistic for goodness-of-fit in generalized linear models. Glm. Glm. Smyth: Pearson's goodness of fit statistic as a score test statistic. Institute of Mathematical Statistics Lecture Notes - Monograph Series Pearson's goodness of fit statistic as a score test statistic Gordon K.
Smyth Full-text: Open access PDF File (1062 KB) Chapter information Source, 115-126 Dates First available in Project Euclid: 3 July 2008 Permanent link to this Digital Object Identifierdoi:10.1214/lnms/1215091138 Mathematical Reviews number (MathSciNet) MR2004335. General linear model. 6.1 - Introduction to Generalized Linear Models. Printer-friendly version Thus far our focus has been on describing interactions or associations between two or three categorical variables mostly via single summary statistics and with significance testing.
Models can handle more complicated situations and analyze the simultaneous effects of multiple variables, including mixtures of categorical and continuous variables. For example, the Breslow-Day statistics only works for 2 × 2 × K tables, while log-linear models will allow us to test of homogeneous associations in I × J × K and higher-dimensional tables.
Generalized Linear Models and Estimating Equations - Statistics Solutions. Generalized Estimating Equations extends Generalized Linear Models further by involving dependent data such as, repeated measures, logistic regression and other various models involving correlated data.
In SPSS, Generalized Estimating Equations can be done by selecting “Generalized Linear Models” from the analyze menu, and then selecting the “Generalized Estimating Equations” from the Generalized Linear Models options list. Questions Answered: Do differences exist in IQ and test scores by management position and tenure? Do differences exist in IQ and test scores by management position and time?
What effect did the intervention program have on attitudes and self-esteem among the different races and genders on students from pre-test to post-test?