
Smart Design Mathematik-LOVE-Motiv "All you need is LOVE-Thermobecher, Edelstahl, 14 g, silberfarben Becher für Kaffee oder Tee, ideales Geschenk für Geburtstage, Weihnachten und Silvester: Amazon.de: Küche & Haushalt. MATLAB script for 3D visualizing geodata on a rotating globe: manual. Sometimes it may happen that on a 3D image there is an apparent artifact line, look at the first figure on the right.
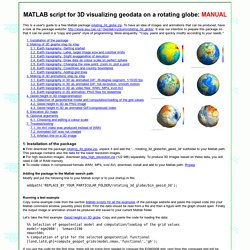
This is not an error, it is due to the fact that the interpolation function does not have data for the whole surface. When developing the package, we found a simple remedy in adding a copy of the first column in the visualized data matrix at the end, and also we add a copy of the first longitude value at the end. For example, if you look at our TOPO elevation data, longitudes "lond_etopo2" are going from -180 till 180 deg, and the first and last columns of "elev_etopo2_km" matrix are the same; in this way, there is no line at the edge of the visualized elevation matrix (see the second figure). If the last duplicated column is deleted: Animated Burning Heart for Matlab. Schwingungsanalyse.
Nach ein paar Jahren in der Autoelektronikentwicklung und vielen Jahren in der Akustikanalyse Gesamtfahrzeug bei BMW im Werk Regensburg hat es mich nach München verschlagen um dort seit 2012 in der Hochschullehre tätig zu sein.
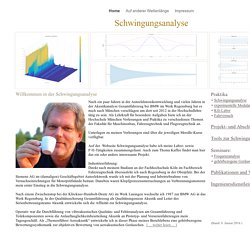
Als Lehrkraft für besondere Aufgaben biete ich an der Hochschule München Vorlesungen und Praktika zu verschiedenen Themen der Fakultät für Maschinenbau, Fahrzeugtechnik und Flugzeugtechnik an. Unterlagen zu meinen Vorlesungen sind über die jeweiligen Moodle-Kurse verfügbar. Auf der Webseite Schwingungsanalyse habe ich meine Labor- sowie F+E-Tätigkeiten zusammengefasst. Auch zum Thema Kaffee findet man hier das ein oder andere interessante Projekt. Industrieerfahrung: Direkt nach meinem Studium an der Fachhochschule Köln im Fachbereich Fahrzeugtechnik übersiedelte ich nach Regensburg in der Oberpfalz.
Index of /study/courses/ISS/public/labs/3_sound. WWU - Mathematik und Informatik. WWU - Mathematik und Informatik. Cubehelix Colormaps: Beautiful, Distinct, Versatile! This is the only colorscheme-generator you will ever need: Cubehelix are the best colormaps for published or distributed documents!
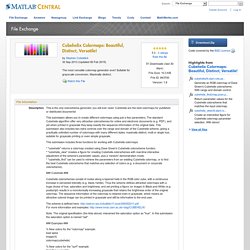
This submission allows you to create different colormaps using just a few parameters. The standard Cubehelix algorithm offer very attractive colorschemes for online and electronic documents (e.g. PDF), and yet when printed in grayscale they keep exactly the sequence information of the original data. Spectrum of Sampled Complex Sinusoid. Example: Synthesis of 1/F Noise (Pink Noise) White Noise Colors. Pink noise is a color of noise, not entirely unlike white noise.

Both white noise and pink noise contain all the frequencies that are audible to humans — 20 hertz to 20,000 hertz — but the way their signal power is distributed among those frequencies differs. White noise has equal power per hertz throughout all frequencies, while the power per hertz in pink noise decreases as the frequency increases. As a result, the lower frequencies in pink noise are louder and have more power than the higher frequencies. Create or edit optimization options structure - MATLAB optimset - MathWorks France. Fitten von numerischen Verteilungsfunktionen - Mein MATLAB Forum - goMatlab.de. Experiments with MATLAB - MathWorks France. Tutorial: Keine Angst vor dem function handle - Mein MATLAB Forum - goMatlab.de. Dieses Tutorial möchte zwei Fragen zu einem sehr nützlichen Instrument beantworten, das Matlab-Neuling zunächst leider nur verwirrt: 1.
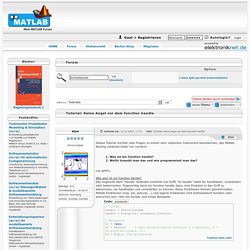
Was ist ein function handle? 2. Wofür braucht man das und wie programmiert man das? Los geht's. Was also ist ein function handle? Lehrstuhl Numerische Mathematik - M2/Allgemeines - IntroProgWS14. Wintersemester 2014/2015 Der Kurs vermittelt elementare Kenntnisse der prozeduralen und objektorientierten Programmierung am Beispiel einer matrixbasierten Hochsprache: Variablen, Zuweisung, arithmetische Operationen, Anweisungen, bedingte Anweisungen, Schleifen, Klassen, Konstruktoren, Attribute, Methoden, Matrix-Vektor-Arithmetik.
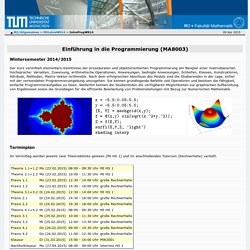
Nach dem erfolgreichen Abschluss des Moduls sind die Studierenden in der Lage, sicher mit der verwendeten Programmierumgebung umzugehen. Sie kennen grundlegende Befehle und Operatoren und besitzen die Fähigkeit, einfache Programmieraufgaben zu lösen. Weiterhin kennen die Studierenden die verfügbaren Möglichkeiten zur graphischen Aufbereitung von Ergebnissen sowie die Grundlagen für die effiziente Bearbeitung von Problemstellungen mit Bezug zur Numerischen Mathematik. Terminplan Im Vormittag werden jeweils zwei Theorieblöcke gelesen (MI HS 1) und im anschließenden Tutorium (Rechnerhalle) vertieft.
Teilnahme Klausur Literatur Links. 1. Introduction - Jupyter Tutorial (IPython 3) Mathematik Software. Creating publication quality figures ← So far, we used raster formats to save our figure.
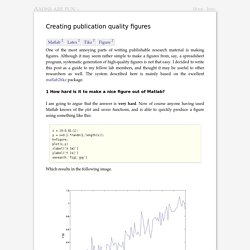
In raster formats (bitmap, jpeg, png, gif, tiff etc.), the colour of each pixel in the image is independently stored. A bitmap image, for instance, is simply an array of colours, each for one pixel of the image. Vector graphics, on the other hand, store data about how the image was generated. For example, a vector image file can simple contain a line telling the viewer to draw a circle, instead of defining the value of all pixels in the image. The great advantage of vector formats over raster formats is the the former can be arbitrarily resized without any loss in quality. Those jagged line (steps) are due to the resizing of the image. So here we have it. There are other problems associated with this approach. These problems led me to use tikz for figures in my thesis. Axes LooseInset property.
Last week, I wrote an article about the hidden/undocumented LineSmoothing plot property.
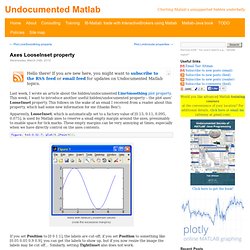
This week, I want to introduce another useful hidden/undocumented property – the plot axes’ LooseInset property. This follows on the wake of an email I received from a reader about this property, which had some new information for me (thanks Ben!). Apparently, LooseInset, which is automatically set to a factory value of [0.13, 0.11, 0.095, 0.075], is used by Matlab axes to reserve a small empty margin around the axes, presumably to enable space for tick marks. These empty margins can be very annoying at times, especially when we have directly control on the axes contents.