
How to pick the right stats test. Type of investigation: The first decision is to decide what sort of investigation you are dealing with.

We can split into two main types - differences or similarities. Differences: In this sort of investigation you are comparing one factor across two places (or categories), in other words you have two separate samples. For example, you may wish to look at the size of ivy leaves on the north facing side of a wall and compare with the size of the leaves on the south facing side.
You may wish to see if there are more mayflies in slow moving pools than in fast parts of a stream. In all cases you have measure or counted one thing and wish to compare this factor across two samples. Similarities: In this kind of investigation you are looking to compare things to see if there is a relationship between them - it's pretty much the opposite of the differences type of investigation. 7 Basic Rules for Making Charts and Graphs. Charts and graphs have found their way into news, presentations, and comics, with users from art to design to statistics.
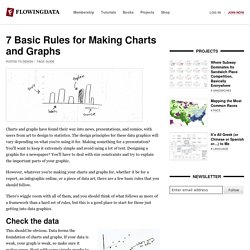
The design principles for these data graphics will vary depending on what you're using it for. Making something for a presentation? You'll want to keep it extremely simple and avoid using a lot of text. Designing a graphic for a newspaper? You'll have to deal with size constraints and try to explain the important parts of your graphic.
However, whatever you're making your charts and graphs for, whether it be for a report, an infographic online, or a piece of data art, there are a few basic rules that you should follow. There's wiggle room with all of them, and you should think of what follows as more of a framework than a hard set of rules, but this is a good place to start for those just getting into data graphics. Check the data This should be obvious. Explain encodings. Data Mining, Predictive Modeling, Techniques. Data Mining Data Mining is an analytic process designed to explore data (usually large amounts of data - typically business or market related - also known as "big data") in search of consistent patterns and/or systematic relationships between variables, and then to validate the findings by applying the detected patterns to new subsets of data.
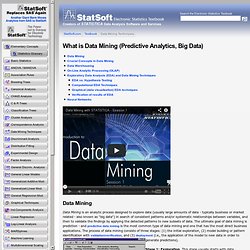
The ultimate goal of data mining is prediction - and predictive data mining is the most common type of data mining and one that has the most direct business applications. The process of data mining consists of three stages: (1) the initial exploration, (2) model building or pattern identification with validation/verification, and (3) deployment (i.e., the application of the model to new data in order to generate predictions). Stage 1: Exploration. Stage 2: Model building and validation. Stage 3: Deployment. For information on Data Mining techniques, review the summary topics included below. Berry, M., J., A., & Linoff, G., S., (2000). Fayyad, U. Think like a statistician – without the math. I call myself a statistician, because, well, I'm a statistics graduate student.
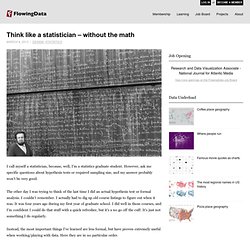
However, ask me specific questions about hypothesis tests or required sampling size, and my answer probably won't be very good. The other day I was trying to think of the last time I did an actual hypothesis test or formal analysis. I couldn't remember. I actually had to dig up old course listings to figure out when it was. It was four years ago during my first year of graduate school. Instead, the most important things I've learned are less formal, but have proven extremely useful when working/playing with data. Attention to Detail Oftentimes it's the little things that end up being the most important. The point is that trends and patterns are important, but so are outliers, missing data points, and inconsistencies. See the Big Picture With that said, it's important not to get too caught up with individual data points or a tiny section in a really big dataset. No Agendas Look Outside the Data Ask Why.