
d3list/ D3 Presentation. Angular-d3 - AngularJS Modules, Plugins and Directives. A set of AngularJS directives that provides a declarative syntax for building common charts using D3.
Installing AngularD3 is available via Bower as angularD3 Project Goals This provides an AngularJS module called ad3 which in turn provides a declarative HTML syntax for using D3 with AngularJS. The syntax has been inspired in part by [this blog post][radian] however since that project is not currently open source I've begun work on building my own. The first goal of this project is to create a simple reusable set of D3 directives that are sufficiently complete to be able to put together flexible charts of nearly any type.
This project is meant to provide enough flexibility to allow for anything d3 is capable of with no limitations, but still provide convenience, re-usability and declarative functionality. If you have ideas and are interested in lending a hand, please open an issue, submit a pull request or just ping me @chrismnicola. Current Directives Try it out Feature Roadmap. Web API. Www.asp.net/posters/web-api/ASP.NET-Web-API-Poster.pdf. Reveal.js - The HTML Presentation Framework. Communication Consolidation. Newfies-Dialer : Voice Broadcasting, Auto-Dialer and IVR Survey Software. D3.js - Data-Driven Documents.
SVCC 2013 D3.js Presentation (10/05/2013) D3.js – thinkDataVis. In this post I will be showing how I made my map for the post, Average age of Brooklyn’s buildings mapped.
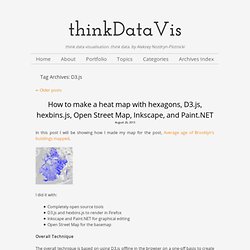
I did it with: Completely open source toolsD3.js and hexbins.js to render in FirefoxInkscape and Paint.NET for graphical editingOpen Street Map for the basemap Overall Technique The overall technique is based on using D3.js offline in the browser on a one-off basis to create a static visual that you will use elsewhere. I outline the technique here in my post, Use D3.js on your desktop to publish static visualisations Get Data You can get the CSV I used here. Creating the Heat for the Map First of all we’re going to be using D3.js along with hexbins.js. Using D3.js as you normally would, and I’m not going to give a complete tutorial on that here… The full code listing is at the bottom of this post. First of all, add an SVG to the document. Now we create two scales to translate the XCoord and YCoord from the Brooklyn data into coordinates in our chart.
HexBinsData = hexbin(data); Done! Average age of Brooklyn’s buildings mapped – thinkDataVis. I saw this recently here.
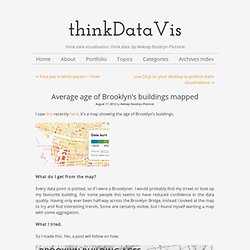
It’s a map showing the age of Brooklyn’s buildings. What do I get from the map? Every data point is plotted, so if I were a Brooklyner, I would probably find my street or look up my favourite building. For some people this seems to have reduced confidence in the data quality. Gource - software version control visualization. Gource - software version control visualization. CodeFlower Source code visualization.
This experiment visualizes source repositories using an interactive tree.
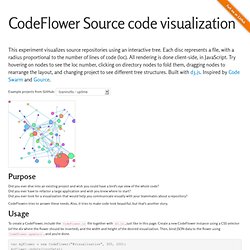
Each disc represents a file, with a radius proportional to the number of lines of code (loc). All rendering is done client-side, in JavaScript. Try hovering on nodes to see the loc number, clicking on directory nodes to fold them, dragging nodes to rearrange the layout, and changing project to see different tree structures. Built with d3.js. Inspired by Code Swarm and Gource. Purpose Did you ever dive into an existing project and wish you could have a bird's eye view of the whole code? CodeFlowers tries to answer these needs. Usage To create a CodeFlower, include the CodeFlower.js file together with d3.js, just like in this page.
Var myFlower = new CodeFlower("#visualization", 300, 200); myflower.update(jsonData); Input data format The jsonData format taken as input to update() is extremely simple. Generating JSON for a project It's easy to generate loc metrics for any project, whatever the language. Licence.