
Svm. Sqldf - Project Hosting on Google Code. To write it, it took three months; to conceive it – three minutes; to collect the data in it – all my life.
F. Scott Fitzgerald Latest News (1) sqldf 0.4-7.1 released to address a bug with dates in 0.4-7. (2) There is now an sqldf discussion group to discuss sqldf (and other of my packages). sqldf is an R package for runing SQL statements on R data frames, optimized for convenience. The user simply specifies an SQL statement in R using data frame names in place of table names and a database with appropriate table layouts/schema is automatically created, the data frames are automatically loaded into the database, the specified SQL statement is performed, the result is read back into R and the database is deleted all automatically behind the scenes making the database's existence transparent to the user who only specifies the SQL statement.
The information below mostly concerns the default SQLite database. John Sall sets JMP 9 free to tango with R. Image via Wikipedia John Sall, founder SAS AND JMP , has released the latest blockbuster edition of flagship of JMP 9 (JMP Stands for John’s Macintosh Program).
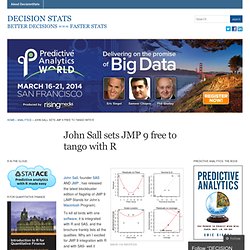
Best of all a JMP 30 day trial is free- so no money lost if you download JMP 9 (and no they dont ask for your credit card number, or do they- but they do have a huuuuuuge form to register before you download. Still JMP 9 the software itself is more thoughtfully designed than the email-prospect-leads-form and the extra functionality in the free 30 day trial is worth it. Also see “New Features in JMP 9 which has this regarding R. Working with RR is a programming language and software environment for statistical computing and graphics.
And the download trial page ( search optimized URL) - In related news (Richest man in North Carolina also ranks nationally(charlotte.news14.com) , Jim Goodnight is now just as rich as Mark Zuckenberg, creator of Facebook- See John’s latest interview : The People Behind the Software: John Sall. Home Page. INFORMS Data Mining Contest 2010: Forum. Dear All, I am pretty proud to announce the following top 3 winners from the overall ranking: 1) Cole Harris from DejaVu Team 2) Christopher Hefele from Swedish Chef Team 3) Nan Zhou from Nan Zhou Team The top 3 winners from the “not using future information” ranking will follow in a couple of days, after asking to all competitors if they used or not future information.
How to build a world-beating predictive model using R. Many modern data analysis problems in both industry and academia involve building a model that can predict the future based on historical variables.
The 2009 KDD Cup was an international data mining competition devoted to this type of problem, where contestants attempted to predict the behaviour of mobile phone customers using an extensive database of historical information. The University of Melbourne team managed to win one part of this challenge, using R almost exclusively. In this talk I’ll give some background to the area and the specific problem, and discuss how we went about building our models. The talk will be fairly accessible, and deal with many of the practical issues encountered in this type of work. Presentation SURF Meet Up Group To leave a comment for the author, please follow the link and comment on his blog: R User Groups. Advanced Graphs. Ruby-statsample's statsample-0.15.0 Documentation. Ruby-statsample.rubyforge.org/ A suite for basic and advanced statistics on Ruby.
Tested on Ruby 1.8.7, 1.9.1, 1.9.2 (April, 2010) and JRuby 1.4 (Ruby 1.8.7 compatible). Include: Descriptive statistics: frequencies, median, mean, standard error, skew, kurtosis (and many others).Imports and exports datasets from and to Excel, CSV and plain text files.Correlations: Pearson’s r, Spearman’s rank correlation (rho), point biserial, tau a, tau b and gamma.
Data Mining Algorithms In R/Classification/SVM - Wikibooks, collection of open-content textbooks. Introduction[edit] Support Vector Machines (SVMs) are supervised learning methods used for classification and regression tasks that originated from statistical learning theory [1].
As a classification method, SVM is a global classification model that generates non-overlapping partitions and usually employs all attributes. Belgium Network of Open Source Analytical Consultants. Motivation for Kolmogorov distance between distributions - Statistical Analysis - Stack Exchange. Package ROCR. ROC graphs, sensitivity/specificity curves, lift charts, and precision/recall plots are popular examples of trade-off visualizations for specific pairs of performance measures. ROCR is a flexible tool for creating cutoff-parameterized 2D performance curves by freely combining two from over 25 performance measures (new performance measures can be added using a standard interface). Curves from different cross-validation or bootstrapping runs can be averaged by different methods, and standard deviations, standard errors or box plots can be used to visualize the variability across the runs.
The parameterization can be visualized by printing cutoff values at the corresponding curve positions, or by coloring the curve according to cutoff. All components of a performance plot can be quickly adjusted using a flexible parameter dispatching mechanism. Despite its flexibility, ROCR is easy to use, with only three commands and reasonable default values for all optional parameters. Package distrEx. An Introduction to R. Table of Contents This is an introduction to R (“GNU S”), a language and environment for statistical computing and graphics.
R is similar to the award-winning1 S system, which was developed at Bell Laboratories by John Chambers et al. It provides a wide variety of statistical and graphical techniques (linear and nonlinear modelling, statistical tests, time series analysis, classification, clustering, ...). This manual provides information on data types, programming elements, statistical modelling and graphics. Semin-r. An R blog from all R blogs. Package ofw. Data Mining Algorithms In R/Dimensionality Reduction/Feature Selection - Wikibooks, collection of open-content textbooks. Feature Selection in R with the FSelector Package[edit] Introduction[edit] In Data Mining, Feature Selection is the task where we intend to reduce the dataset dimension by analyzing and understanding the impact of its features on a model. R Tutorial Series: Introduction to The R Project for Statistical Computing (Part 2)
Data Wrangling - machine learning, datamining, algorithms, python code, and more. Statistics 380 Web Pages - Lecture Slides. Zero Intelligence Agents. This happens to be one of those rare instances where the benefit of hindsight does not make me regret something said flippantly on a panel.
I deeply believe that in order to truly change the world we cannot simply "throw analytics at the problem. " To that end, the medical and health industries are perhaps the most primed to be disrupted by data and analytics. To be successful, however, a deep respect for both the methodological and clinical contexts of the data are required. It is incredibly exciting to be at an organization that is both working within the current framework of health care and data to create new insight for people, but also pushing the envelope with respect to individuals' relationships with their own health. The challenges are technical, sociological, and political; but the potential for innovation that exists in this space comes along very rarely. I feel lucky to have an opportunity to move into the health data space now. Sensor data Strength of team.
R Graphical Manual.