
Visualization: Motion Chart - Google Charts. Overview A dynamic chart to explore several indicators over time.
The chart is rendered within the browser using Flash. Note for Developers: Because of Flash security settings, this (and all Flash-based visualizations) might not work correctly when accessed from a file location in the browser (e.g., rather than from a web server URL (e.g., This is typically a testing issue only. You can overcome this issue as described on the Adobe web site.
Example. Visualization: Motion Chart - Google Charts. Colorblind Web Page Filter. Highcharts Cloud Beta. Datawrapper. Climat. Accueil - Data.gouv.fr. The World Top Incomes Database. How to: Comment faire un Google Motion Chart. Three-dimensional Mapping. Create amazing maps with your data — CartoDB. TileMill. Bienvenue sur le projet QGIS ! Batch Geocode. OpenStreetMap. How to Find the Right Chart Type for your Numeric Data. 22 Feb 2016 Charts help you visualize numeric data in a graphical format but the problem is there are just too many types of charts to choose from.
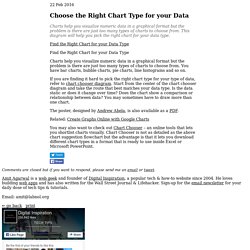
This diagram will help you pick the right chart for your data type. couch mode print story Charts help you visualize numeric data in a graphical format but the problem is there are just too many types of charts to choose from. Raw.