
Animations & Multimedia - Mr Leitch's Biology. NGSS. Statistics Notes: Standard deviations and standard errors. Standard error of the mean. When you take a sample of observations from a population, the mean of the sample is an estimate of the parametric mean, or mean of all of the observations in the population.

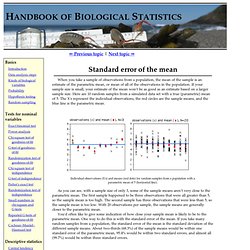
If your sample size is small, your estimate of the mean won't be as good as an estimate based on a larger sample size. Here are 10 random samples from a simulated data set with a true (parametric) mean of 5. The X's represent the individual observations, the red circles are the sample means, and the blue line is the parametric mean. As you can see, with a sample size of only 3, some of the sample means aren't very close to the parametric mean.
The first sample happened to be three observations that were all greater than 5, so the sample mean is too high. You'd often like to give some indication of how close your sample mean is likely to be to the parametric mean. Here's a figure illustrating this. Usually you won't have multiple samples to use in making multiple estimates of the mean. Similar statistics Example. Standard Deviation and Variance. Deviation just means how far from the normal Standard Deviation The Standard Deviation is a measure of how spread out numbers are.

Its symbol is σ (the greek letter sigma) The formula is easy: it is the square root of the Variance. So now you ask, "What is the Variance? " Variance The Variance is defined as: The average of the squared differences from the Mean. To calculate the variance follow these steps: Work out the Mean (the simple average of the numbers)Then for each number: subtract the Mean and square the result (the squared difference).Then work out the average of those squared differences. Example You and your friends have just measured the heights of your dogs (in millimeters): The heights (at the shoulders) are: 600mm, 470mm, 170mm, 430mm and 300mm. Find out the Mean, the Variance, and the Standard Deviation. Your first step is to find the Mean: Answer:
Don't Want Cancer? Sweat It Off. Cancer sucks.

No, wait: cancer REALLY sucks. Most of us perceive cancer as a gruesome condition that slowly degrades health and dignity. Though enormous advances in cancer therapy have been made in the last 30 years, the best option remains: just don’t get it. Cancer can be difficult to conceptualize: many common forms (in first-world countries, save lung cancer and cervical cancer) have no clear pathogen. To add confusion, the ones that do, like lung cancer, can still affect non-smokers who make it a point to avoid second-hand smoke.
A few months ago Jordan Rapp asked me to pen an article or two. 1) People who do aerobic exercise tend to develop less cancer than sedentary individuals 2) The best mechanism to explain #1 has implications for slowing aging as well In 2009 a group in Great Britain published a meta-analysis of 40 case-controlled studies in peer-reviewed scientific journals ( on exercise and cancer. Why does this matter? So, a correlation has no teeth without causation. Ryon. Explore.
Biology. Personal. Getting started. Anatomy & Physiology.