
Internet Archive: Wayback Machine. What's a good value for R-squared? Linear regression models Notes on linear regression analysis (pdf file)
Better Traffic and Revenue Forecasting: Amazon.es: Dr Luis Willumsen: Libros en idiomas extranjeros. 5.2.4. Are the model residuals well-behaved? How Important Are Normal Residuals in Regression Analysis? I’ve written about the importance of checking your residual plots when performing linear regression analysis.

If you don’t satisfy the assumptions for an analysis, you might not be able to trust the results. One of the assumptions for regression analysis is that the residuals are normally distributed. Typically, you assess this assumption using the normal probability plot of the residuals. Are these nonnormal residuals a problem? If you have nonnormal residuals, can you trust the results of the regression analysis? Answering this question highlights some of the research that Rob Kelly, a senior statistician here at Minitab, was tasked with in order to guide the development of our statistical software.
Simulation Study Details The goals of the simulation study were to: determine whether nonnormal residuals affect the error rate of the F-tests for regression analysis generate a safe, minimum sample size recommendation for nonnormal residuals There were 10,000 tests for each condition. Neural Network Modeling Using Sas Enterprise Miner - Randall Matignon - Google Books. Estadística para todos. R-squared adj. in multiple linear regression of 75% = high correlation? How to Interpret Regression Analysis Results: P-values and Coefficients - Adventures in Statistics.
Regression analysis generates an equation to describe the statistical relationship between one or more predictor variables and the response variable.
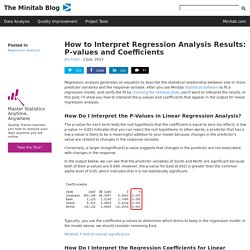
After you use Minitab Statistical Software to fit a regression model, and verify the fit by checking the residual plots, you’ll want to interpret the results. In this post, I’ll show you how to interpret the p-values and coefficients that appear in the output for linear regression analysis. How Do I Interpret the P-Values in Linear Regression Analysis? The p-value for each term tests the null hypothesis that the coefficient is equal to zero (no effect). A low p-value (< 0.05) indicates that you can reject the null hypothesis. Conversely, a larger (insignificant) p-value suggests that changes in the predictor are not associated with changes in the response.
In the output below, we can see that the predictor variables of South and North are significant because both of their p-values are 0.000. Related: F-test of overall significance Be sure to: Why You Need to Check Your Residual Plots for Regression Analysis: Or, To Err is Human, To Err Randomly is Statistically Divine - Adventures in Statistics. Anyone who has performed ordinary least squares (OLS) regression analysis knows that you need to check the residual plots in order to validate your model.
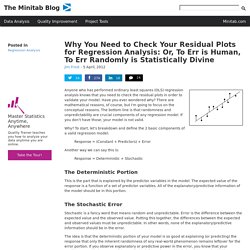
Have you ever wondered why? There are mathematical reasons, of course, but I’m going to focus on the conceptual reasons. The bottom line is that randomness and unpredictability are crucial components of any regression model. If you don’t have those, your model is not valid. Why? Response = (Constant + Predictors) + Error Another way we can say this is: Response = Deterministic + Stochastic The Deterministic Portion This is the part that is explained by the predictor variables in the model. The Stochastic Error Stochastic is a fancy word that means random and unpredictable. The idea is that the deterministic portion of your model is so good at explaining (or predicting) the response that only the inherent randomness of any real-world phenomenon remains leftover for the error portion. Using Residual Plots.