
Daily UX Crash Course: 31 of 31. (If you’re just starting the UX Crash Course: Start Here.)
Let me paint the picture a little bit first… Imagine that you want to design a page to sell shoes. And, of course, you want to sell as many shoes as possible. What do you think would get more people to buy? A video of the shoes? How do you choose? If your first thought was “ask the users!” So how can you decide between subjective things, like a boss?! The answer: Design all the things! What is an A/B Test? An A/B test is a way of asking thousands or millions of real visitors which option is best.
The tests makes sure that each unique visitor only sees one option, then — after enough people have gone through your test — you can see which version of the design created more clicks. You can do it with 2 versions, or 20 version. A couple details: 1) A/B Testing is usually free, other than the time it takes to design and create the pages you’re testing. 3) An A/B Test is most reliable when you only change one detail. That’s it! Daily UX Crash Course: 30 of 31. (If you’re just starting the UX Crash Course: Start Here.)
There are two graph styles that human behavior creates fairly often: Traffic and Structured Behaviour. One little note: I have used a “bar graph” in these examples because it was faster to draw. Your analytics may use different types of graphs. Daily UX Crash Course: 29 of 31. (If you’re just starting the UX Crash Course: Start Here) There are 7 basic stats that you will need to understand if you want to do anything with a website.
Not just what they measure, but what they mean. Numbers are not good or bad: 1 million users is only good if it’s higher than last month. If you’re Facebook and you have 1 million users this month, you’re in trouble. Before you analyze anything, take aminute to think about what your site is supposed to do, and realize what numbers would indicate that type of behaviour. 1 & 2) Total Visits & Unique Visits This may surprise you, but Total Visits measures the number of times your site has been visited, total. Unique Visits is a little different though. Daily UX Crash Course: 28 of 31. (If you’re just starting the UX Crash Course: Start Here.)
Data is Objective In one of the early lessons we learned about user research. Daily UX Crash Course: 27 of 31. (If you’re just starting the UX Crash Course: Start Here.)
Power Users are the Minority: Statistically-speaking, it is impossible for advanced or power users to be “most” of the people using your design. Although it can be very tempting to believe that. Unless your product/service is highly technical the vast majority of your users will be normal people with other shit to do. Not super-focused, tech-savvy people like you and your colleagues. Hard truth: If you want millions of happy users, design for the distracted idiots, not the obsessed geniuses. Hidden vs. In most projects there will be situations where you have to decide how “clean” you want your layout to be.
Designers will usually choose to hide everything because it looks better. Non-designers will want all of their favourite features to be visible all the time. So how do you choose? Visible features will always be used more and discovered more than hidden features. Make sure beginners can find the core features easily. Daily UX Crash Course: 26 of 31. Daily UX Crash Course: 25 of 31. (If you’re just starting the UX Crash Course: Start Here) What is Conditioning?
It has nothing to do with how far you can run, but it has everything to do with what you expect and what you want. If you have heard of Pavlov’s drooling dogs, then you might be familiar with “conditioning” in a scientific context. In fact, if you have a dog, you might have even used conditioning before, when you trained them to sit, shake hands, do your taxes, and so on. It works just as well on people. Conditioning is the fundamental principle that animals — including humans — will do something again if they are rewarded, and they will avoid doing it again if they are punished. That might seem obvious, but 99% of the designers I’ve met ignore it in their UX designs. Rewards and Punishments are feelings, not things. When we talk about rewarding users, 9 out of 10 people automatically think about offering the chance to win an iPhone or movie tickets or something else equally dumb.
Would you like to do that again? Daily UX Crash Course: 24 of 31. (If you’re just starting the UX Crash Course: Start Here.)
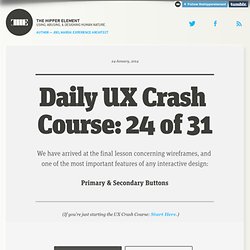
The example above shows two button examples (don’t click them). As a general guideline you will only need two button styles, because most user actions fall into one of two categories: 1) Primary Actions that are helpful to our goals.2) Secondary Actions that are not. Primary Buttons: Some actions that are available to the user are productive, like registering, buying, submitting content, saving, sending, sharing, and so on. Buttons that execute primary actions — primary buttons — should be as visible as possible.
Primary Style: High contrast compared to the background. Position in Layout: On or near the Axis of Interaction so users notice them first, by reflex. Daily UX Crash Course: 23 of 31. (If you’re just starting the UX Crash Course: Start Here.)
There are four places when a UX designer might give input about the words being used to communicate with users. Otherwise, it’s a good idea to let the content creators do their thing. Daily UX Crash Course: 22 of 31. (If you’re just starting the UX Crash Course: Start Here.)
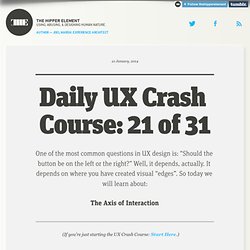
Forms are one of the places you will spend a lot of your time, usability-wise. They cause confusion, mistakes, and loss of engagement, and they are one of the most valuable parts of your site. If they aren’t one of the most valuable parts of your design, why are you using a form? Did I mention that they cause confusion, mistakes, and loss of engagement? One Long Page or A Few Short Pages? The most common question with forms — from UX designers and marketers alike — is “how long is too long?” It is a good general rule to keep forms as short as possible, but don’t be afraid to break it into pages if it makes sense, or if you want to save information in steps, just in case the user quits in the middle.
The main thing is to make a form feel simple. Input Types The purpose of a form is to get input. i.e. — information from the user. For example, lets say you want the user to pick their favourite type of goat. Labels & Instructions. Daily UX Crash Course: 21 of 31. (If you’re just starting the UX Crash Course: Start Here.)
This idea is deceptively simple. Human attention is very limited. We can only focus on one thing at a time, like a squirrel or boobs or Duck Dynasty. Daily UX Crash Course: 20 of 31. (If you’re just starting the UX Crash Course: Start Here.) The Fold: One of the most popular old-school misconceptions is about “The Fold” which — in case you’ve never heard of it — is the part of your design that is visible before the user scrolls.
Everything above The Fold will get maximum visibility. However, from the studies I have seen, you can expect 60-80% of users to scroll if they expect to find something useful below the fold. Whatever is above The Fold should inform users about what is below The Fold. Careful: It is popular right now to use huge background images at the top of the page. Daily UX Crash Course: 19 of 31. (If you are just starting the UX Crash Course, Start Here.) Although it might be tempting to approach your wireframes on a page-by-page basis, don’t do it! This is one of those “measure twice, cut once” kind of things. As a general rule, you should do your wireframes like you do your tattoos: start with the big parts and add details as you go.
Daily UX Crash Course: 18 of 31. (If you’re just starting the UX Crash Course, Start Here.) The words above can mean a variety of things in the real world, so for the purposes of this lesson: Browsing is when you go to Ikea to look at all the model rooms “just to get ideas” and you walk out with a bunch of random crap anyway. Searching is when you go to Ikea looking for a new sofa that will fit in your absurdly small apartment. Discovery is when you find the sofa you’re looking for, and also buy those clever little nested end-tables because they are so damn clever and nested. As if those are things you need in your life. Daily UX Crash Course: 17 of 31. (If you’re just starting the UX Crash Course, Start Here.) Using a website or an app may feel like a different experience every time, but in fact, the way people look at any design is fairly predictable… The Z-Pattern: Let’s start with the most boring design I can imagine: an entire newspaper page of solid text.
Daily UX Crash Course: 16 of 31. (If you’re just starting the UX Crash Course, Start Here.) Today we say goodbye to the Old-Timey Rubber Ducks, but first they will demonstrate two of the most fundamental principles of visual perception. The ducks aren’t just pretty faces! Daily UX Crash Course: 15 of 31. Daily UX Crash Course: 14 of 31. Daily UX Crash Course: 13 of 31. Daily UX Crash Course: 12 of 31. Daily UX Crash Course: 11 of 31. Daily UX Crash Course: 10 of 31. (If you’re just starting the UX Crash Course, Start Here.) A User Story describes one possible path a user can take on your site or app. It should be short, but complete. You will need many user stories to describe your whole design. A basic user story for Google.com might look like this: Daily UX Crash Course: 9 of 31. Daily UX Crash Course: 8 of 31. Daily UX Crash Course: 7 of 31.
Daily UX Crash Course: 5 of 31. Daily UX Crash Course: 4 of 31. Daily UX Crash Course: 3 of 31. Daily UX Crash Course: 2 of 31. Daily UX Crash Course: 1 of 31.