
Reporting Just Got Interesting. Over 100 Incredible Infographic Tools and Resources (Categorized) This post is #6 in DailyTekk’s famous Top 100 series which explores the best startups, gadgets, apps, websites and services in a given category.

Total items listed: 112. Time to compile: 8+ hours. Follow @DailyTekk on Twitter to make sure you don’t miss a week! OpenStreetMap. Data Visualization Demo. Sign In. Create Infographics online. Debategraph. Timeline JS - Beautifully crafted timelines that are easy, and intuitive to use. Interactive maps and visualizations. Charts Made Easy. Data Made Social. Venngage. Create Infographics. My Playground. Piktochart- Infographic & Presentation Tool. Create and share visual ideas online. Infogr.am. Infographics & Data Visualization. KPI Dashboard, Business Intelligence - Social Media Monitoring Dashboard. Make Free Cartoons and Animations - Sketch Star. Diagram Software to draw Flowcharts, UML diagrams & more Online. Data Science Toolkit. Visualizing online social networks. Gephi, an open source graph visualization and manipulation software. Public Data Explorer.
Mining, Mapping and Visualizing the Blogosphere. DataArt on BBC Backstage - Flared Music. SEO Keyword Graph Visualization. Use this free Java application to explore the connections between related websites.
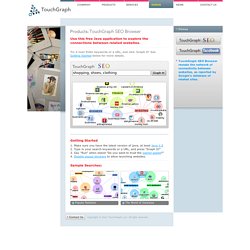
Try it now! Enter keywords or a URL, and click 'Graph it! ' See Getting Started below for more details. Getting Started Make sure you have the latest version of java, at least Java 1.5 Type in your search keywords or a URL, and press "Graph It! " Graph Words. VizRank: Data Visualization Guided by Machine Learning. DoodleBuzz: Typographic News Explorer. Debategraph. Oursignal.
Create Professional Timeline Charts - Dipity. Web-based Timeline Software. Web Design Inspiration: 44 Eye-Catching Slideshows. Blog or website presentation is a crucial factor that needs to be considered to attract attention for viewers and surfers alike… Many website owners today find ways and means to come up with cool accessories and styles for their websites… One option is applying slideshow… Not only does it add color and life, it also gives the owner a chance to features the best content they have… This next post on 44 Eye-Catching Slideshows has been compiled to inspire you with the effectiveness and benefits that you can achieve when applied in web design.

Based on this list of websites, slideshows are mostly effective on homepage… Feel free to view the sources from which the images came from… Who knows, it may give you ideas to add one for yourself… You may want to take a look at the following related articles: • 45+ Inspiring Examples of Vintage in Web Design • 30 Beautiful and Illustrative Website Footers • 40+ Examples of Horizontal Scrolling Websites. High Detail Social Icons: Xing Icon. Sponsored links Follow us xing Search tag Good (7) Bad (0) Remove tag social Search tag Good (3) Bad (0) Remove tag hosting Search tag Good (2) Bad (0) Remove tag.
Newest Iconsets - Page 5. 45+ Free Premium WordPress Themes with Magazine or Grid Layouts. CleanPRESS A Free Premium Wordpress Theme. Chart Tools. Thanks for choosing Tableau Public. Your download should begin automatically, but if it doesn’t, click here.
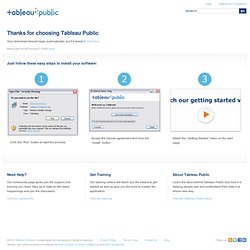
Need the 64-bit version? Click here. Just follow these easy steps to install your software: Click the “Run” button to start the process. Depending on your browser, you might not get the security warning screen.Go to step 2. Accept the license agreement and click the “Install” button. The software will automatically begin the installation process. Watch the “Getting Started” video on the start page. Press the play button and get a step-by-step walk through of how to create your first Tableau Public visualization. Need Help? Our community page gives you the support and training you need. Visit our community Get Training Our training videos will teach you the basics to get started as well as give you the tools to master the application. Visit our training About Tableau Public Learn the story behind Tableau Public and how it is helping people see and understand their data in a whole new way.
Visit the Tableau Public Story. Chartle.net. Number Picture - Crowd-Sourcing New Ways For People To Visualize Data. SPAM VISUALIZATION - wordScore. AmCharts. AnyChart. Many Eyes. Bubble Chart. When to use a bubble chart A bubble chart displays a set of numeric values as circles.
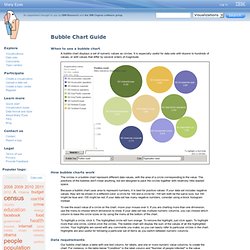
It is especially useful for data sets with dozens to hundreds of values, or with values that differ by several orders of magnitude. How bubble charts work The circles in a bubble chart represent different data values, with the area of a circle corresponding to the value. The positions of the bubbles don't mean anything, but are designed to pack the circles together with relatively little wasted space. Because a bubble chart uses area to represent numbers, it is best for positive values. To see the exact value of a circle on the chart, move your mouse over it. To highlight a circle, click it.