
Simply Statistics. Pages Basics.
Datasciencectacontent/pml-ghPagesSetup.md at master · lgreski/datasciencectacontent. Leo Breiman. Leo Breiman passed away on July 5, 2005.
Professor Breiman was a member of the National Academy of Sciences. His research in later years focussed on computationally intensive multivariate analysis, especially the use of nonlinear methods for pattern recognition and prediction in high dimensional spaces. He was a co-author of Classification and Regression Trees and he developed decision trees as computationally efficient alternatives to neural nets. This work has applications in speech and optical character recognition. He was the author of the textbooks Probability and Stochastic Processes with a View Toward Applications, Statistics with a View Toward Applications, and Probability.
Selected Papers Some papers are available. WALD Lectures Three pdf files are available from the WALD lectures, presented at the 277th meeting of the Institute of Mathematical Statistics, held in Banff, Alberta, Canada (July 28 to July 31, 2002). Machine LearningLooking Inside the Black BoxSoftware for the Masses. A Community Site for R – Sponsored by Revolution Analytics. Home Page. Shiny - Tutorial. The How to Start Shiny video series will take you from R programmer to Shiny developer.
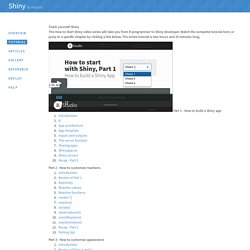
Watch the complete tutorial here, or jump to a specific chapter by clicking a link below. The entire tutorial is two hours and 25 minutes long. Part 1 - How to build a Shiny app Part 3 - How to customize appearance You will get the most out of these tutorials if you already know how to program in R, but not Shiny. If R is new to you, you may want to check out the learning resources at www.rstudio.com/training before taking one of these tutorials. If you use Shiny on a regular basis, you may want to skip these tutorials and visit the articles section of the Development Center. Shiny JavaScript Tutorial Herman Sontrop and Erwin Schuijtvlot of FRISS are writing a series of lessons that will teach you how to create custom JavaScript widgets and embed them into your Shiny apps. R powered web applications with Shiny The written tutorial Continue to lesson 1.
Home Page. A deterministic statistical machine. As Roger pointed out the most recent batch of Y Combinator startups included a bunch of data-focused companies.
One of these companies, StatWing, is a web-based tool for data analysis that looks like an improvement on SPSS with more plain text, more visualization, and a lot of the technical statistical details “under the hood”. I first read about StatWing on TechCrunch, where the title, “How Statwing Makes It Easier To Ask Questions About Data So You Don’t Have To Hire a Statistical Wizard”. StatWing looks super user-friendly and the idea of democratizing statistical analysis so more people can access these ideas is something that appeals to me. But, as one of the aforementioned statistical wizards, this had me freaked out for a minute. Once I looked at the software though, I realized it suffers from the same problem that most “user-friendly” statistical software suffers from. The advantage is that people can get their data-related questions answered using a standard tool.
RPubs. Aggregate {stats} Compute Summary Statistics of Data Subsets Description Splits the data into subsets, computes summary statistics for each, and returns the result in a convenient form.
Usage aggregate(x, ...) ## S3 method for class 'default': aggregate((x, ...)) ## S3 method for class 'data.frame': aggregate((x, by, FUN, ..., simplify = TRUE)) ## S3 method for class 'formula': aggregate((formula, data, FUN, ..., subset, na.action = na.omit)) ## S3 method for class 'ts': aggregate((x, nfrequency = 1, FUN = sum, ndeltat = 1, ts.eps = getOption("ts.eps"), ...)) Arguments x an R object. RR Peer 1. Data Science Specialization. Read Statistical inference for data science. About this book This book is written as a companion book to the Statistical Inference Coursera class as part of the Data Science Specialization.
However, if you do not take the class, the book mostly stands on its own. A useful component of the book is a series of YouTube videos that comprise the Coursera class. The book is intended to be a low cost introduction to the important field of statistical inference. Bcaffo/courses. Coursera Wiki. Practice_assignment/practice_assignment.rmd at master · rdpeng/practice_assignment.
Bootcamp. Machine Learning & Statistical Learning. Book. Elements of Data Analytic… by Jeff Leek. DataScienceSpecialization/DataScienceSpecialization.github.io. Data Science Specialization.