
Online Statistics Courses. What is Statistics?

Statistics is an academic discipline concerned with the collection, graphic representation, and analysis of data taken from specific population surveys. College statistics programs often focus on three subsections of statistical study: applied, theoretical, and mathematical statistics. Applied statistics courses consolidate the study of descriptive and inferential statistics, which uses results from probability studies to explain clear numeric correlations in data as well as the more random results. On-campus and online statistics courses that discuss theoretical statistics use logic and probability theory to explain why data sets yield certain results while mathematical statistics are concerned with fundamentally altering experiment designs to create different probability data.
What Can Online Courses in Statistics Actually Teach Me? Which experiment factors have direct numeric correlations with one another? Free Online Courses in Statistics From Around the Web. Linear regression analysis. An important part of statistical analysis is being able to look at graphical representation of data, extract meaning and make comments about it, particularly related to the context.

Graph interpretation is a difficult skill to teach as there is no clear algorithm, such as mathematics teachers are used to teaching, and the answers are far from clear-cut. This post is about the challenges of teaching scatterplot interpretation, with some suggestions. When undertaking an investigation of bivariate measurement data, a scatterplot is the graph to use. On a scatterplot we can see what shape the data seems to have, what direction the relationship goes in, how close the points are to the line, if there are clear groups and if there are unusual observations. The problem is that when you know what to look for, spurious effects don’t get in the way, but when you don’t know what to look for, you don’t know what is spurious.
So how do we teach this? The following uses the framework provided by R. Assistments. Resources for AP Statistics, Intro to Statistics, and R. Data Finder. Getting and Using Data. Statistics in Sports: Sports Data Resources. Derby lines, futures wagers, betting tips, news and results.
Statistics for every Kentucky Derby since 1875, presented in 25 year intervals.

Includes the names of the win, place and show horse, margin of victory, the winning jockey, total number of Derby nominees, number of starters, winning time, net pay-out to winner and track condition. UDC Data Reports. Skip directly to search Skip directly to A to Z list Skip directly to navigation Skip directly to site content Skip directly to page options CDC Home Centers for Disease Control and Prevention - Your Online Source for Credible Health Information <div class="noscript"> Note: Javascript is disabled or is not supported by your browser.

For this reason, some items on this page will be unavailable. For more information about this message, please visit this page: <a href="/Other/about_cdcgov.html" title="Browser requirements for CDC.gov">About CDC.gov</a>. Blood Disorders UDC Homepage On this Page UDC Data Reports Data Reports: Available to the Public The purpose of the surveillance reports listed below is to disseminate the information collected through the Universal Data Collection (UDC) program to care providers, public health workers, community advocates, health educators and planners, patients in the bleeding disorders community and others. Specify location: National Regional. Data and Information Services Center (DISC)
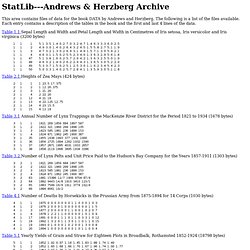
Browse Resources. Databases, Tables & Calculators by Subject. SEER Data, 1973-2009. Fertility rate, total (births per woman. Andrews & Herzberg Archive. This area contains files of data for the book DATA by Andrews and Herzberg.

The following is a list of the files available. Each entry contains a description of the tables in the book and the first and last 4 lines of the data. Table 1.1 Sepal Length and Width and Petal Length and Width in Centimetres of Iris setosa, Iris versicolor and Iris virginica (3200 bytes) Table 2.1 Heights of Zea Mays (424 bytes) Table 3.1 Annual Number of Lynx Trappings in the MacKenzie River District for the Period 1821 to 1934 (1678 bytes) Table 3.2 Number of Lynx Pelts and Unit Price Paid to the Hudson's Bay Company for the Years 1857-1911 (1303 bytes) Table 4.1 Number of Deaths by Horsekicks in the Prussian Army from 1875-1894 for 14 Corps (1030 bytes) Table 5.1 Yearly Yields of Grain and Straw for Eighteen Plots in Broadbalk, Rothamsted 1852-1924 (18798 bytes) Table 6.1 The Plan of the Wheat Field and the Yield of Grain and Straw of Five Hundred Wheat Plots (6644 bytes)
Data Visualization Gallery.