
35 Cool Infographics for Web and Graphic Designers. Inspiration June 10, 2011 Let’s be honest, we tend to get bored with reading too much text and it’s rather difficult to understand descriptive information especially if they signify numbers or statistics.
To make things easier, we use graphs, illustrations and flowcharts to make them visually appealing yet, at the same time, easy to understand. One of the latest online trends that graphic designers make use of are infographics. Infographics, short for Information graphics, are said to be visual representations of a study or data. Infographics are not just mere digital artworks. Onextrapixel - Web Design & Development Magazine.
Infographics (or information graphics) are everywhere these days.
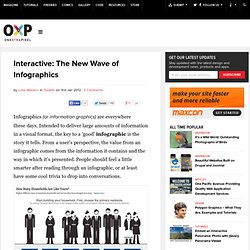
Intended to deliver large amounts of information in a visual format, the key to a ‘good’ infographic is the story it tells. From a user’s perspective, the value from an infographic comes from the information it contains and the way in which it’s presented. People should feel a little smarter after reading through an infographic, or at least have some cool trivia to drop into conversations. Image credit: How Many Households Are Like Yours? Organisations use infographics for a variety of reasons - building brand awareness, PR and gaining links back to their site, which can have a positive impact on their Google rankings. Infographics as a Creative Assessment. Life After Death by Powerpoint 2010. HelloSlide.
MyBrainshark. Presentation Zen · masonj1. Present.me.