background preloader

STATISTIQUES ET DONNEES

Facebook Twitter

Visual Literacy: An E-Learning Tutorial on Visualization for Communication, Engineering and Business. How It Works. The Visual Thesaurus is an interactive dictionary and thesaurus which creates word maps that blossom with meanings and branch to related words. Its innovative display encourages exploration and learning. You'll understand language in a powerful new way. Say you have a meaning in mind, like "happy. " The VT helps you find related words, from "cheerful" to "euphoric. " The best part is the VT works like your brain, not a paper-bound book.
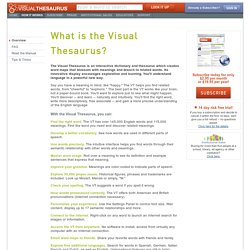
You'll want to explore just to see what might happen. You'll discover -- and learn -- naturally and intuitively. With the Visual Thesaurus, you can: Find the right word. Click on the images below to watch the videos. Here are 6 basic steps on how to use the Visual Thesaurus. Www-969.ibm. Visual Understanding Environment.

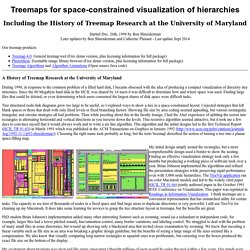
Data Journalism Awards - 2014 Shortlist. BBC “Thousands of syringes found on Scotland’s streets, “INTERACTIVE: How many discarded syringes have been found where you live? ,” “Scottish independence: Billboards publicising White Paper cost £84,000,” “INTERACTIVE: Where did the Scottish government place billboard posters to publicize the White Paper? “Scottish independence: A third of MSPs lodge questions on independence,” “INTERACTIVE: What has your MSP asked about Scottish independence? “DATABASE: What has your MSP asked about Scottish independence? “Scottish independence: Global interest in Scots White Paper,” “INTERACTIVE: Global interest in Scots White Paper,” “Toronto city hall’s biggest lobbyists? Labordoc - Labordoc. La boite à outils. Treemaps for space-constrained visualization of hierarchies. Started Dec. 26th, 1998 by Later updates by Ben Shneiderman and Catherine Plaisant - Last update Sept 2014 Our treemap products: Treemap 4.0: General treemap tool (Free demo version, plus licensing information for full package) PhotoMesa: Zoomable image library browser (Free demo version, plus licensing information for full package) Treemap Algorithms and Algorithm Animations (Open source Java code) A History of Treemap Research at the During 1990, in response to the common problem of a filled hard disk, I became obsessed with the idea of producing a compact visualization of directory tree structures.

Since the 80 Megabyte hard disk in the HCIL was shared by 14 users it was difficult to determine how and where space was used. Tree structured node-link diagrams grew too large to be useful, so I explored ways to show a tree in a space-constrained layout. My initial design simply nested the rectangles, but a more comprehensible design used a border to show the nesting. Information Is Beautiful. Tools on Datavisualization.ch. A Carefully Selected List of Recommended Tools 07 May 2012 Tools Flash, JavaScript, Processing, R When I meet with people and talk about our work, I get asked a lot what technology we use to create interactive and dynamic data visualizations. To help you get started, we have put together a selection of the tools we use the most and that we enjoy working with.

Read more Pathline: Connecting Designers With Scientists 18 Apr 2012 Tools We recently attended an interdisciplinary visualization workshop that was all about creating a dialogue between scientists, technologists and designers. New Maps for the Web by Stamen 22 Mar 2012 Tools JavaScript, Mapping I just left the Stamen studio where I had a brief chat with founder and CEO Eric Rodenbeck. The Visualizing Player 19 Jul 2011 Showcases, Tools Visualizing.org launched their brand new Visualizing Player, a terrific tool for embedding interactive and static data visualizations.

Working with Data in Protovis 17 Feb 2011 Tools JavaScript, Tutorial. Aide de MicroStrategy Web. Statistiques européennes sur les accidents du travail. Source : Eurostat Analyse des statistiques par sexe et tranche d'âge Les accidents du travail sont beaucoup plus fréquents chez les hommes que chez les femmes, avec un ratio d'incidence plus de deux fois plus élevé (et trois fois en Allemagne).

La dangerosité des métiers plutôt exercés par les hommes expliquent en partie cette différence importante, mais l'attention plus grande portée à la prévention des risques par les femmes n'est certainement pas étrangère à cette grande disparité. La fréquence et la gravité des accidents augmente sensiblement et régulièrement avec l'âge (baisse de la faculté de récupération de l'organisme), mais on assiste aussi à un déplacement des secteurs les plus à risque vers ceux où l'on retrouve beaucoup de jeunes travailleurs qui sont moins formés, moins expérimentés, avec notamment des emplois précaires (saisonniers, intérimaires…).

Analyse des statistiques par secteurs d'activité Health Health and safety at work. Startseite - BGW-online. La donnée du jour : Accidents du travail en France de 1996 à 2007. Plus ou moins d’accidents du travail en France ? La réponse ici. Accidents du travail en France de 1996 à 2007: L’amélioration de la situation est sensible et concerne toutes les branches d’activité. La baisse du nombre d’accidents du travail est la plus importante dans la construction : plus d’un tiers d’accidents en moins entre 1997 et 2007. En revanche, on observe une stagnation dans le secteur des transports et des communications. L’amélioration générale est à mettre sur le compte d’une amélioration nette de la sécurité, de la prévention et de la formation sur le long terme dans chacune des branches concernées. Toutefois, cette amélioration n’est pas spécifique à la France : elle concerne l’ensemble des pays développés.

Accidents du travail en Allemagne entre 1997 et 2007 Données Eurostat. 3050 jeux de données à visualiser classés par thèmes Cliquez sur le thème qui vous intéresse Vous aussi créez vos visualisations et intégrez les facilement dans vos blogs et articles : Mode d’emploi.