
Albert-László Barabási. Albert-László Barabási (born March 30, 1967) is a Romanian-born Hungarian-American physicist, best known for his work in the research of network theory.
He is the former Emil T. Hofmann Professor at the University of Notre Dame and current Distinguished Professor and Director of Northeastern University's Center for Complex Network Research (CCNR) associate member of the Center of Cancer Systems Biology (CCSB) at the Dana–Farber Cancer Institute, Harvard University, and visiting professor at the Center for Network Science[1] at Central European University. He introduced in 1999 the concept of scale-free networks and proposed the Barabási–Albert model to explain their widespread emergence in natural, technological and social systems, from the cellular telephone to the World Wide Web or online communities. He is the Founding President of the Network Science Society,[2] which grew out of and sponsors the flagship NetSci conference held yearly since 2006 Birth and education[edit] Awards[edit]
Counties Blue and Red, Moving Right and Left - Interactive. Center for Spatial Research. Center for Spatial Research. On the eve of an historic and controversial peace agreement in Colombia we have launched an investigation into the spatial characteristics of the decades long conflict between multiple state and non-state actors in the country.
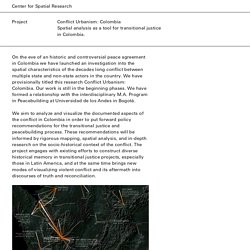
We have provisionally titled this research Conflict Urbanism: Colombia. Our work is still in the beginning phases. We have formed a relationship with the interdisciplinary M.A. Conflict Urbanism: Colombia - Displacements. Visualizacion Datos. Infographic Elements 34. Set Of Vector Design Elements In Flat Style For Business Presentation, Booklet, Web Site And Projects. Stock Vector - Image: 46241793. Datos Abiertos Colombia. Ciudatos. Creating Simple Webmap using QGIS. Emprendedor: cómo aprender rápido #infografia #infographic #education. Cómo aprender y no olvidar #infografia #infographic #education. Data Visualization Infographics Archives - Last week, W5 attended the 2nd annual The Quirk’s Event in Brooklyn.
The two-day conference offered inspiring sessions, fruitful networking and even a MR Jam Session. While we were unable to attend all the sessions, we wanted to share with you a few of our favorites. Here is the second highlight summary in our series. Data, Dashboards, PowerPoint and Infographics – The MR Reporting Landscape Today and into the Future not only piqued my interest but led me to think beyond the future of reporting. Below are my thoughts on some of the predictions for the future of marketing research reporting. Virtual Reality replicates an environment that simulates a physical presence in places in the real world or an imagined world, allowing the user to interact in that world.
14 Ejemplos De Las Mejores Visualizaciones De Datos. El siguiente artículo es una traducción del blog data-visualization.org.
Gracias a su propietario por concederme el permiso de traducción. He traducido únicamente las 14 de las 20 visualizaciones que más me han gustado. +100 herramientas para el análisis de redes sociales #sna #ars. El Análisis de Redes Sociales (ARS) o Social Network Analysis (SNA) es una técnica clave en muchos campos como la sociología, la biología, comunicación, política… Permite analizar relaciones entre elementos para determinar la importancia de los actores, cómo se han agrupado en subcomunidades, el flujo de la información, qué es clave en la transmisión de la información… Ya hace unos años que la vengo utilizando de manera habitual.
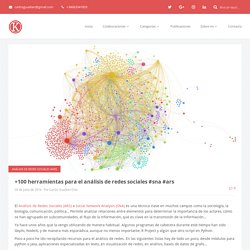
Algunos programas de cabecera durante este tiempo han sido Gephi, NodeXL y de manera más esporádica, aunque no menos importante, R Project y algún que otro script en Python. Poco a poco he ido recopilando recursos para el análisis de redes. Introduction to Map Design — The Map Academy — CARTO. Circle of Trust « D3. Circle of Trust How asymmetric is your relationship network at Google Plus?
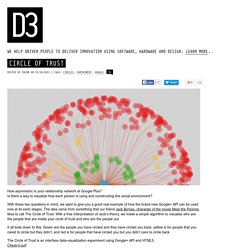
Is there a way to visualize how each person is using and constructing this social environment? With these two questions in mind, we want to give you a good real example of how the brand new Google+ API can be used now at its early stages. The idea came from something that our friend Jack Byrnes, character of the movie Meet the Parents, likes to call The Circle of Trust. Data Visualization: How To Merge Form & Function And Make Great #Infographics. Infographic Design: The Best Way to Create Infographics. Open source HTML5 Charts for your website. The Five Best Libraries For Building Data Visualizations.
An explosion in the number of available data sources and data-processing tools means that more people than ever are jumping into the world of data visualization.
But with so much to learn, it can be intimidating to know just where to start. So which library is best, and what advice do the pros have? Read on and find out. Like telling the history of personal computers without mentioning Steve Jobs, it’s impossible to talk about data visualization without talking about D3. Arguably the most dominant and important programming library in the field, D3 (short for Data Driven Documents) is an open source JavaScript library usually used to generate SVG graphics. D3.js - Data-Driven Documents. Abierto al público 6 recursos para analizar los avances e impacto de los dato... 9 Beautiful Maps That You Would Like To See. Maps show us direction and beauty definitely add values to them.
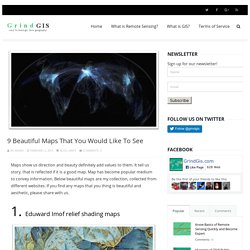
It tell us story, that is reflected if it is a good map. Map has become popular medium to convey information. Below beautiful maps are my collection, collected from different websites. Noun Project - Icons for Everything. Design and publish beautiful maps. Mapping Stereotypes.