
Pre-Civilization. 100 Diagrams That Changed the World. Since the dawn of recorded history, we’ve been using visual depictions to map the Earth, order the heavens, make sense of time, dissect the human body, organize the natural world, perform music, and even concretize abstract concepts like consciousness and love. 100 Diagrams That Changed the World (public library) by investigative journalist and documentarian Scott Christianson chronicles the history of our evolving understanding of the world through humanity’s most groundbreaking sketches, illustrations, and drawings, ranging from cave paintings to The Rosetta Stone to Moses Harris’s color wheel to Tim Berners-Lee’s flowchart for a “mesh” information management system, the original blueprint for the world wide web.
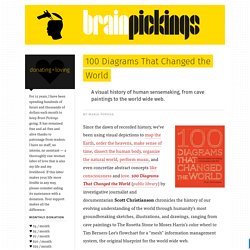
It appears that no great diagram is solely authored by its creator. Most of those described here were the culmination of centuries of accumulated knowledge. Most arose from collaboration (and oftentimes in competition) with others. Christianson offers a definition: Diseño con texto. We Are From The Future... Ascend Academy: Creative Energy. Welcome back spiritual seekers, this is Ascend Academy’s Phase 2, Creative Energy.
This is a very large topic, and as a result, this will be quite a lengthy and informative article. Take a deep breath and get ready for some mind blowing revelations. Feel free to take a break about halfway through and come back to it, as there are a lot of concepts to cover. Also, please understand that this is my spiritual framework, a pragmatic way of viewing the spiritual reality.
I am not saying this is absolutely true, I am simply stating this has come to be my truth through my experience and study and I invite you to create your own reality in whichever way you see fit. In the reality beyond time, space, beliefs, and all manifestations, only two notions exist. Light, meaning energy that radiates out of a SOURCE, is the Male creative energy. This is where the Female Creative Energy comes in, which is that of absorption and reflection. Soul Mind The Energy Body Nadis Hope you enjoyed the article Namaste. Free photos. 10 sites pour créer une infographie. Les infographies permettent de visualiser plus facilement un ensemble de données parfois complexe. Une image est parfois plus parlante qu’un long discours ! Infographics tools. 100 Diagrams That Changed the World. Make your own infographics.
Infographics (or Information Graphics) are graphic visual representations of data or information, presented in a way to make it easier to consume information.
Infographics gained popularity in the mid-2000′s with the advent of sites like Digg and Reddit, and have quickly become one of the most popular methods to display researched data. There are three main types of infographics – where data is presented in a timeline, where statistical data is presented in graphs or with icons, or where data is presented on a map. In order to create an infographic which will be widely shared, think about your typography, colours, and layout. Make it easy for people to understand the information that’s being provided. Sometimes it’s best to keep things simple. You can also get very creative with how you display your information, and do something completely unconventional. Infographics are among the most popular modern methods of sharing information with an audience.
Where to get visual statistics. Infographics.