
Where is the Space Station? – Code Club. First open the url for the web service in a new tab in your web browser: should see something like this:{ "iss_position": { "latitude": 8.54938193505081, "longitude": 73.16560793639105 }, "message": "success", "timestamp": 1461931913 }The result contains the coordinates of the spot on Earth that the ISS is currently over.Longitude is the East-West position and runs from -180 to 180. 0 is the Prime Meridian which runs through Greenwich in London, UK.Latitude is the North-South position and runs from 90 to -90. 0 is the Equator.Now you need to call the same web service from Python.
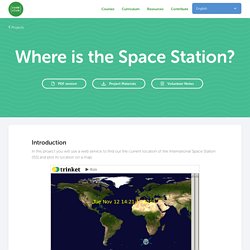
Add the following code to the end of your script to get the current location of the ISS: Let’s create variables to store the latitude and longitude, and then print them: It would be more useful to show the position on a map.First we’ll need to import the turtle graphics library. Let’s load a world map as the background image, there’s one already included in your trinket. Gmaps.js API. Get Started with Debugging JavaScript in Chrome DevTools This tutorial teaches you the basic workflow for debugging any JavaScript issue in DevTools.
Read on, or watch the video version of this tutorial, below. Step 1: Reproduce the bug Finding a series of actions that consistently reproduces a bug is always the first step to debugging. Click Open Demo. The demo opens in a new tab. GoJS Sample Diagrams for JavaScript and HTML, by Northwoods Software. Javascript. Chrome Developer Tools: Best resource for learning advanced features? Tools for Web Developers Chrome DevTools is a set of authoring, debugging, and profiling tools built into Google Chrome.
Open DevTools Select More Tools > Developer Tools from Chrome's Main Menu.Right-click a page element and select Inspect.Press Command+Option+I (Mac) or Control+Shift+I (Windows, Linux). Discover DevTools Device Mode. Learning Chrome Web Developer Tools. Released All major browsers include developer tools, which enable developers to examine the code of a webpage or app, as well as run tests and evaluate metrics related to that code.

Chrome Developer Tools (DevTools for short) is the industry standard. Explore how the tools work in actual testing and debugging scenarios and get an expanded toolbox for your day-to-day work. This course teaches the most widely used parts of DevTools, using sample files to walk through identifying issues and bugs, fixing them, and then verifying that they've been fixed. Each chapter digs into a different tool, including the Console, Elements panel, and Network panel, exploring how it's useful and when to use it.
Chrome Developer Tools. Learn How To Debug JavaScript with Chrome DevTools – codeburst. That’s the basic idea of stepping through code.
If you look at the code in get-started.js, you can see that the bug is probably somewhere in the updateLabel() function. Rather than stepping through every line of code, you can use another type of breakpoint to pause the code closer to the location of the bug. Line-of-code breakpoints are the most common type of breakpoint. When you’ve got a specific line of code that you want to pause on, use a line-of-code breakpoint.