
Grace. Grace is a WYSIWYG 2D plotting tool for the X Window System and M*tif.
Grace runs on practically any version of Unix-like OS. As well, it has been successfully ported to VMS, OS/2, and Win9*/NT/2000/XP (some minor functionality may be missing, though). Grace is a descendant of ACE/gr, also known as Xmgr.
Genius. Liste. Fityk. Dynamique moléculaire. WarpLAB. WarpLAB WarpLAB is a finite element (FE) post-processing application that is specially designed to post-process warping problems.
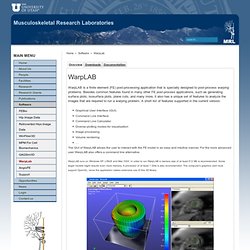
Besides common features found in many other FE post-process applications, such as generating surface plots, isosurface plots, plane cuts, and many more, it also has a unique set of features to analyze the images that are required to run a warping problem. A short list of features supported in the current version: Graphical User Interface (GUI) Command Line Interface Command Line Calculator Diverse plotting modes for visualization Image processing Volume rendering … The GUI of WarpLAB allows the user to interact with the FE model in an easy and intuitive manner. WarpLAB runs on Windows XP, LINUX and Mac OSX.
WarpLab Support Please contact steve.maas@utah.edu with questions or to report a bug. The R Project for Statistical Computing.
VisIt. PostView. Postview is a finite element post-processor that is designed to post-process the results from FEBio. It offers the user a graphical user interface to visualize and analyze the FE model. Several tools are available to assist the user in this process, such as surface plots, isosurface plots, vector plots, plane cuts and several other. These tools can be used to visualize data such as displacements, velocities, strains, stresses and so on. Values at nodes and elements can be interrogated for a more detailed study. All data can be visualized as a time history using the TrackView tool. PostView Download Files Download files are zipped and include the executable file, documentation and examples. If you experience problems with downloads or come across any issues on the site please contact us.
MayaVi. OpenDX. Gnuplot. Syracuse. Gnuplot: An Interactive Plotting Program - Table of Contents. Gnuplot: An Interactive Plotting Program GNUPLOT An Interactive Plotting Program Thomas Williams & Colin Kelley Version 3.7 organized by: David Denholm Copyright (C) 1986 - 1993, 1998 Thomas Williams, Colin Kelley Mailing list for comments: info-gnuplot@dartmouth.edu Mailing list for bug reports: bug-gnuplot@dartmouth.edu This manual was prepared by Dick Crawford 3 December 1998 Major contributors (alphabetic order): Hans-Bernhard Broeker John Campbell Robert Cunningham David Denholm Gershon Elber Roger Fearick Carsten Grammes Lucas Hart Lars Hecking Thomas Koenig David Kotz Ed Kubaitis Russell Lang Alexander Lehmann Alexander Mai Carsten Steger Tom Tkacik Jos Van der Woude James R.
Van Zandt Alex Woo. Plotutils. The GNU plotutils package contains software for both programmers and technical users.
Its centerpiece is libplot, a powerful C/C++ function library for exporting 2-D vector graphics in many file formats, both vector and bitmap. On the X Window System, it can also do 2-D vector graphics animations. libplot is device-independent, in the sense that its API (application programming interface) does not depend on the type of graphics file to be exported. A Postscript-like API is used both for file export and for graphics animations. A libplot programmer needs to learn only one API: not the details of many graphics file formats. The package also contains command-line programs for plotting scientific data, such as GNU graph for XY plotting. SVG (Scalable Vector Graphics format), the XML-based format for Web graphics, which is standardized by the W3 Consortium. The current version of the plotutils package is 2.6, released September 2009. Demo scripts. Gnuplot tips (not so Frequently Asked Questions) Veusz. Veusz is a GUI scientific plotting and graphing package.
It is designed to produce publication-ready Postscript or PDF output. SVG, EMF and bitmap export formats are also supported. The program runs under Unix/Linux, Windows or Mac OS X, and binaries are provided. Data can be read from text, CSV, HDF5 or FITS files. In addition, you can also enter, manipulate or examine data from within the application. Packages:DebianFedoraFreeBSDGentooNetBSDOpenBSDopenSUSEUbuntu PPA. SALOME Platform.
ParaView. Gmsh. Christophe Geuzaine and Jean-François Remacle Version 2.8.4, February 7 2014 Description | Download | Authors and credits | Documentation | Licensing | Screenshots | Links | References Description Gmsh is a 3D finite element grid generator with a build-in CAD engine and post-processor.
Its design goal is to provide a fast, light and user-friendly meshing tool with parametric input and advanced visualization capabilities. See the screencasts for a quick tour of Gmsh's graphical user interface, or the reference manual for a more thorough overview of Gmsh's capabilities and some frequently asked questions. Download Gmsh is distributed under the terms of the GNU General Public License (GPL): Current stable release: Windows 32 bit / 64 bit, Linux 32 bit / 64 bit, Mac OS X and source code A tutorial introducing all key features and concepts is included in all the versions in the tutorial directory.