
KJB de signets graphiques's Tumblelog. We Feel Fine / by Jonathan Harris and Sep Kamvar. Working with Data in Protovis on Datavisualization. Protovis is an open-source Javascript visualization library by the Stanford Visualization Group and has become one of the preferred tools in our arsenal.
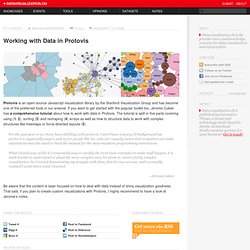
If you want to get started with the popular toolkit too, Jerome Cukier has a comprehensive tutorial about how to work with data in Protovis. The tutorial is split in five parts covering using (1, 2), sorting (3) and reshaping (4) arrays as well as how to structure data to work with complex structures like treemaps or force-directed layouts (5). Datasets on Datavisualization. Wikileaks US Embassy Cables 29 Nov 2010 Datasets Infographic, Politics Wikileaks began on Sunday November 28th publishing 251,287 leaked United States embassy cables, the largest set of confidential documents ever to be released into the public domain.
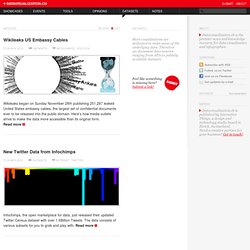
Here's how media outlets strive to make the data more accessible than its original form. Read more New Twitter Data from Infochimps. Showcases on Datavisualization. Interactively Explore the YOLO Flip 12 Feb 2014 Showcases Animation, Interactive, Process, Sports In preparation of the Winter Olympic Games 2014 in Sochi, we helped the Swiss newspaper Neue Zürcher Zeitung publish a long-form article about Iouri Podladtchikov, a professional snowboarder and – since yesterday – freshly baked Olympic gold medalist.

To help readers better understand the sport, we created a series of illustrations and an interactive animation. Read more Analyzing Presidential Candidate’s Body Language. La Société de Schématologie et de Bibliologie. Atelier Vuarnoz - Tsunami Visual Thesaurus - Visueller Prototyp. Poïétique du design » Data flow. Théorie générale de la ...