
How to Create a Clever Infographic.
Infographics & Data Visualization. 25 Best Online Tools to Create Your Own Infographics. Today’s article is dedicated to all those users who’s looking for some of the best Online tools to Create Infographics.
So must try this opinion piece covered by us. We all know that visual representation speaks more than words written on paper and slideshow. The reason, is that it’s very easy to convey knowledge and engage its viewers. And due to which these Infographic things are very popular among users and creating lots of heat. I’m a blogger and know its importance in today life. Ok, let me ask one you one question, Out of full-length 1000-word article and one Infographinc which one you like to choose of go with. So would you like to make your own Infographics and looking for some platform to make that thing happen then this article is surely your cup of tea. 1. Wordle is one of the best web app using which you can create beautiful and fully customizable word clouds Infographic just with few clicks. 2. 3. 4. 5. 6. 7. 8. 9. 10. 11. amCharts Visual Editor.
Infographics, Charting and Mapping Tools & Apps #stats #statistics #graphics #infographics #infographic #graphs #in #imagesinformation #datavisualization #maps #bigdata #mapping #charts #charting #datamapping. MockFlow - Online Wireframe Tool. Infographic. Information graphics or infographics are graphic visual representations of information, data or knowledge intended to present complex information quickly and clearly.[1][2] They can improve cognition by utilizing graphics to enhance the human visual system’s ability to see patterns and trends.[3][4] The process of creating infographics can be referred to as data visualization, information design, or information architecture.[2] Overview[edit] Infographics have been around for many years and recently the proliferation of a number of easy-to-use, free tools have made the creation of infographics available to a large segment of the population.

Social media sites such as Facebook and Twitter have also allowed for individual infographics to be spread among many people around the world. In newspapers, infographics are commonly used to show the weather, as well as maps, site plans, and graphs for statistical data. "Graphical displays should: Graphics reveal data. History[edit] Early[edit] What are infographics? Infographics or information graphics are visual representations of information, data or knowledge.
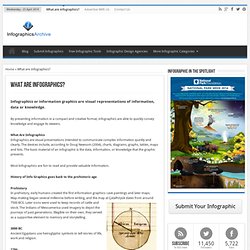
By presenting information in a compact and creative format, infographics are able to quickly convey knowledge and engage its viewers. What Are Infographics Infographics are visual presentations intended to communicate complex information quickly and clearly. The devices include, according to Doug Newsom (2004), charts, diagrams, graphs, tables, maps and lists.
The basic material of an infographic is the data, information, or knowledge that the graphic presents. Most Infographics are fun to read and provide valuable information. History of Info Graphics goes back to the prehistoric age Prehistory In prehistory, early humans created the first information graphics: cave paintings and later maps. Were used to keep records of cattle and stock. 3000 BC Ancient Egyptians use heiroglyphic symbols to tell stories of life, work and religion. How Do I Create An Infographic? 13 Reasons Why Your Brain Craves Infographics [HTML 5]