
Using Tesseract OCR with Python. In last week’s blog post we learned how to install the Tesseract binary for Optical Character Recognition (OCR).
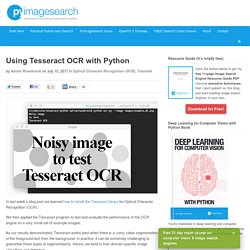
We then applied the Tesseract program to test and evaluate the performance of the OCR engine on a very small set of example images. As our results demonstrated, Tesseract works best when there is a (very) clean segmentation of the foreground text from the background. In practice, it can be extremely challenging to guarantee these types of segmentations. Hence, we tend to train domain-specific image classifiers and detectors. Nevertheless, it’s important that we understand how to access Tesseract OCR via the Python programming language in the case that we need to apply OCR to our own projects (provided we can obtain the nice, clean segmentations required by Tesseract). In the remainder of this blog post, we’ll learn how to install the Tesseract OCR + Python “bindings” followed by writing a simple Python script to call these bindings.
The Hitchhiker’s Guide to d3.js – Ian Johnson – Medium. Digital Humanities Pedagogy: Practices, Principles and Politics. TEI by Example. Overcoming the Challenges of Digital Research: A Tutorial – Portus Classroom. Timothy Walsh May 5, 2016 Professor David Thomas Introduction.

Quickstart Guide. Background A topic model is a simplified representation of a collection of documents.
Topic modeling software identifies words with topic labels, such that words that often show up in the same document are more likely to receive the same label. GitHub - scottythered/gratefuldata: Grateful Data isn't programming code, but an online tutorial about data acquisition, cleaning and enriching, using publicly accessible data on the band the Grateful Dead as examples. Read the Wiki to find out how to use. Detecting Locations with NER. By Aaron Braunstein, Clare Jensen, and Kaitlyn Sisk This page discusses the digital data collection tool Named Entity Recognition (NER) and its use in organizing the geographic information in runaway slave advertisements.
Rationale In past analyses of runaway slave advertisements, the primary method utilized to collect data has been close reading, as illustrated in John Hope Franklin and Loren Schweninger’s book Runaway Slaves: Rebels on the Plantations. The authors chose fugitive slave advertisements as relatively credible sources since owners would have high incentives to provide accurate descriptions so their runaway(s) could easily be identified. They employed close reading to observe the nature of slavery on a personal level (Franklin and Scheninger, 295). Our goal was to understand differences in location references within runaway slave ads across the Texas, Arkansas, and Mississippi corpora. Named Entity Recognition came to the rescue. Methodology Named Entity Recognition Application.
Palaeography tutorial (how to read old handwriting) Palaeography is the study of old handwriting.
This web tutorial will help you learn to read the handwriting found in documents written in English between 1500 and 1800. Text Analysis » Tooling Up for Digital Humanities. Topic Modeling for Humanists: A Guided Tour – the scottbot irregular. It’s that time again!
Somebody else posted a really clear and enlightening description of topic modeling on the internet. Let’s Make a Map. Note: This article was written in 2012 and uses old versions of D3 and TopoJSON.
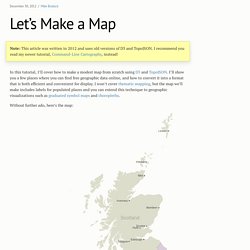
I recommend you read my newer tutorial, Command-Line Cartography, instead! In this tutorial, I’ll cover how to make a modest map from scratch using D3 and TopoJSON. I’ll show you a few places where you can find free geographic data online, and how to convert it into a format that is both efficient and convenient for display. I won’t cover thematic mapping, but the map we’ll make includes labels for populated places and you can extend this technique to geographic visualizations such as graduated symbol maps and choropleths. Without further ado, here’s the map: Shown are the four constituent countries of the United Kingdom: Scotland, Northern Ireland, Wales and England.
#Finding Data The first task for any map is finding geometry. Unfortunately, government data can sometimes be hard to find or use. For a crowdsourced alternative, GeoCommons is a platform for sharing geographic datasets. #Installing Tools. About these worksheets. These worksheets are intended to give you practice doing historical data analysis using the R programming language.
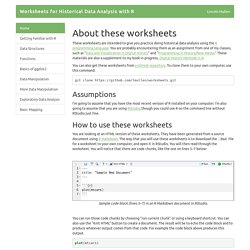
You are probably encountering them as an assignment from one of my classes, such as “Data and Visualization in Digital History” and “Programming in History/New Media.” These materials are also a supplement to my book in progress, Digital History Methods in R. You can also get these worksheets from a GitHub repository. To clone them to your own computer, use this command: Exploring Big Historical Data: The Historian's Macroscope. Welcome to the companion site for Exploring Big Historical Data: The Historian’s Macroscope, published by Imperial College Press.
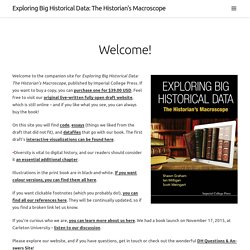
If you want to buy a copy, you can purchase one for $39.00 USD. Feel free to visit our original live-written fully open draft website, which is still online – and if you like what you see, you can always buy the book! TxDHC Webinar Series. Speaker Videos. The first video covers introductions from the workshop’s sponsors MITH and the NEH ODH, via Neil Fraistat, Jen Guiliano, and Jen Serventi; Matthew Jockers presenting on literary topic modeling with “Thematic Change and Authorial Innovation in the 19th Century Novel”; and Robert Nelson on historical topic modeling with”Analyzing Nationalism and Other Slippery ‘Isms’”.
Topic Modeling Workshop: Jockers and Nelson from MITH in MD on Vimeo. The second video covers Jo Guldi and Christopher Johnson-Roberson’s presentation “Paper Machines: A Tool for Analyzing Large-Scale Digital Corpora” Topic Modeling Workshop: Guldi and Johnson-Roberson from MITH in MD on Vimeo. The third video covers David Mimno’s presentation “The details: how we train big topic models on lots of text”. A Gentle Introduction to Correspondence Analysis. There are some digital humanists who are competent mathematicians, but most of us experience some anxiety about the more advanced mathematics involved in the text analysis methodologies that we use. Dammit Jim, I’m a humanist, not a mathematician! The problem of course is that there are clearly some statistical and graphical techniques that can be very powerful for humanities research (if you’re unconvinced by this claim, please read on anyway). So one faces a choice: not using these techniquesusing these techniques naïvely and trusting that they’re working properly and that one is interpreting the results properlyinvesting a ton of time learning the mathematics involved, sometimes to the detriment of the original research agendacollaborating with someone who does understand the mathematics Correspondence Analysis is a good example of a technique that can appear very intimidating but that can also be a very powerful tool in the arsenal of a digital humanist.
Code School - Try R. Create with Fusion Tables - Fusion Tables Help. Create with Fusion Tables These tutorials step you through using Fusion Tables’ features to accomplish neat things with your data. See what others have done in the Example Gallery. Basic tutorials. Plain Text Note and Citation Management. Hacks Posted by W. Caleb McDaniel on May 5, 2014. Installing QGIS 2.0 and Adding Layers. Lesson Goals In this lesson you will install QGIS software, download geospatial files like shapefiles and GeoTIFFs, and create a map out of a number of vector and raster layers.
Quantum or QGIS is an open source alternative to the industry leader, ArcGIS from ESRI. QGIS is multiplatform, which means it runs on Windows, Macs, and Linux and it has many of the functions most commonly used by historians. ArcGIS is prohibitively expensive and only runs on Windows (though software can be purchased to allow it to run on Mac). However, many universities have site licenses, meaning students and employees have access to free copies of the software (try contacting your map librarian, computer services, or the geography department). Installing QGIS Navigate to the QGIS Download page. Mac Instructions For most people it will be best to choose Master release (the one that has a single installer package). Windows Instructions under Standalone Installer, click on the link to Download QGIS. Machine Learning for Artists.
Flexbox Game.