
Debategraph. The Views menu lets you toggle between different visualizations of the map or parts of the map – with each type of view having specific strengths and uses.
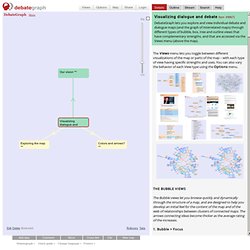
You can also vary the behavior of each View type using the Options menu. The Bubble views let you browse quickly and dynamically through the structure of a map, and are designed to help you develop an initial feel for the content of the map and of the web of relationships between clusters of connected maps. Top Project Management Apps Infographic. Facilitation graphique. The architecture of everything. Graphic Facilitation: Transforming Groups With the Power of Visual Listening. This fall I get the treat of using my new Graphic Faciliation book to lead a Principles of Graphic Facilitation training in Baltimore.
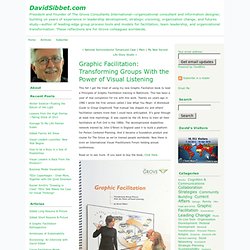
This has been a year of real completion for me with this work. Twenty six years ago in 1980 I wrote the first version called I See What You Mean: A Workbook Guide to Group Graphics® That manual has shaped my and others' facilitation careers more than I could have anticipated. It’s gone through at least nine reprintings. Onlinefacilitation. "Every child is an artist.
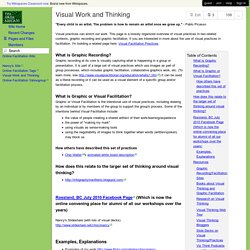
Theproblem is how to remain an artist once we grow up. " - Pablo Picasso Visual practices can enrich our work. This page is a loosely organized overview of visual practices in two related contexts, graphic recording and graphic facilitation. If you are interested in more about the use of visual practices in facilitation, I'm building a related page here: Visual Facilitation Practices What is Graphic Recording? Graphic Facilitation. What is a Visual Practitioner?
As Visual Practitioners we weave a graphic component into our work. We literally draw information out of people, functioning as facilitators and scribes to get the wisdom of groups into a tangible form . . . read more. Sketchnoting For Absolute Beginners. I've taken up sketchnoting recently, and I love it!
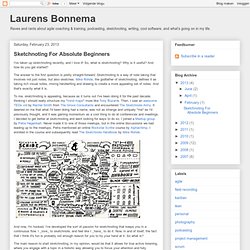
So, what is sketchnoting? Why is it useful? And how do you get started? The answer to the first question is pretty straight-forward: Sketchnoting is a way of note taking that involves not just notes, but also sketches. Mike Rohde, the godfather of sketchnoting, defines it as taking rich visual notes, mixing handwriting and drawing to create a more appealing set of notes. To me, sketchnoting is appealing, because as it turns out I've been doing it for the past decade, thinking I should really structure my "mind maps" more like Tony Buzan's. And now, I'm hooked. The main reason to start sketchnoting, in my opinion, would be that it allows for true active listening, where you engage with a topic in a holistic way allowing you to focus your attention and fully immerse yourself in a subject, be it a talk at a conference, a meeting or a group discussion.
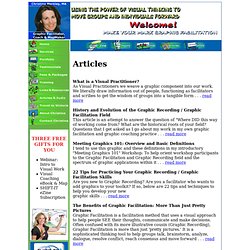
So, how do you start? I've done two presentations/workshops on sketchnoting so far. Common Craft Cut-Out Library. Become a Rockstar Scribe at School or Work. The Leaders of Visual Planning, Team Performance, and Graphic Facilitation for over 30 Years. Visual Thinking. Visual thinking refers to a group of generative skills that, when practiced with rigorous discipline, results in the production of novel and original graphic ideas.
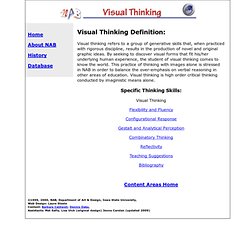
By seeking to discover visual forms that fit his/her underlying human experience, the student of visual thinking comes to know the world. This practice of thinking with images alone is stressed in NAB in order to balance the over-emphasis on verbal reasoning in other areas of education. Visual thinking is high order critical thinking conducted by imaginistic means alone. Specific Thinking Skills: Analytical Thinking Skills. IFVP Community. Sketchnote Army - A Showcase of Sketchnotes. The sketchnote revolution. I’ve got an idea for a new year’s resolution: Join the sketchnote revolution.
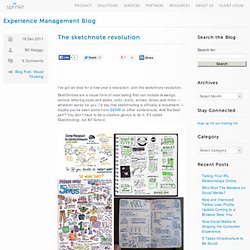
Sketchnotes are a visual form of note-taking that can include drawings, various lettering sizes and styles, color, icons, arrows, boxes and more — whatever works for you. I’d say that sketchnoting is officially a movement — maybe you’ve seen some from SXSWi or other conferences. And the best part? You don’t have to be a creative genius to do it. It’s called Sketchnoting, not Art School. But these sketchnotes are pretty great. We all go to conferences. Enter sketchnotes. Seriously, anybody can do it.
Benefits of Sketchnotes In my view there are two ways to do sketchnotes. Draw liveDraw live and later Most that you see are drawn live. Other times I draw everything live. I know others take different approaches — usually sketching everything then and there — but this works well for me. Sketchnoting 101: How To Create Awesome Visual Notes. Sketchnoting For Absolute Beginners. Visual Thinking. Home » All CFT Teaching Guides » Visual Thinking by CFT graduate program coordinator Maria Ebner & assistant director Derek Bruff Introduction Our brains are wired to rapidly make sense of and remember visual input.
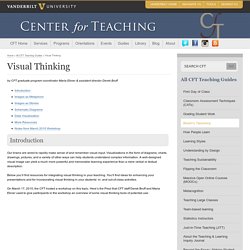
Visualizations in the form of diagrams, charts, drawings, pictures, and a variety of other ways can help students understand complex information. A well-designed visual image can yield a much more powerful and memorable learning experience than a mere verbal or textual description. Below you’ll find resources for integrating visual thinking in your teaching. On March 17, 2010, the CFT hosted a workshop on this topic. For more notes from the workshop, as well as ideas participants generated during the workshop, see the bottom of this page.
The Reading Brain in the Digital Age: The Science of Paper versus Screens. In a viral YouTube video from October 2011 a one-year-old girl sweeps her fingers across an iPad's touchscreen, shuffling groups of icons.
In the following scenes she appears to pinch, swipe and prod the pages of paper magazines as though they too were screens. When nothing happens, she pushes against her leg, confirming that her finger works just fine—or so a title card would have us believe. The Work of Edward Tufte and Graphics Press. Graphics Press LLC P.O.
Box 430 Cheshire, CT 06410 800 822-2454 Edward Tufte is a statistician and artist, and Professor Emeritus of Political Science, Statistics, and Computer Science at Yale University. He wrote, designed, and self-published 4 classic books on data visualization. The New York Times described ET as the "Leonardo da Vinci of data," and Bloomberg as the "Galileo of graphics. " He is now writing a book/film The Thinking Eye and constructing a 234-acre tree farm and sculpture park in northwest Connecticut, which will show his artworks and remain open space in perpetuity.