
Unit 1 - Gregg Shorthand. Unit 1 1. Shorthand is written by sound; thus aim is written am (long sound of a), cat is written kat, knee is written ne. Since we are learning shorthand to save time in writing, it is necessary to ignore those letters that aren't pronounced. Consonants 2. 3. Each of these strokes begins and ends on the same plane. Even though d is about twice the length of t, d should only go up about two thirds of the line of writing. 4. 5. 6. 7. Memory aid: The A Group The E Group Note: The first sound in the E group of vowels is the short i, heard in din, and should not be confused with long i, heard in dine, which will be given later. 8.
Picturing Writing Motion 9. 10. The terms "left motion" and "right motion" refer to the rotation in movement, and not to the direction. How Circles Are Joined The following movement drills are intended to develop skill in the joining of circles. 11. The dotted line shows the position of the circle in relation to the curve. Practice with the following sentences: DiRT Directory. Concept Maps, Network Diagrams and Workflows - Easy...Free...3-D - Simple Mapper. Men's Style Information in Creative Visual Guides.
Top 10 data mining algorithms in plain English. Today, I’m going to explain in plain English the top 10 most influential data mining algorithms as voted on by 3 separate panels in this survey paper.
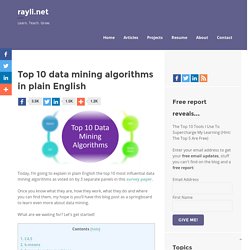
Once you know what they are, how they work, what they do and where you can find them, my hope is you’ll have this blog post as a springboard to learn even more about data mining. What are we waiting for? Let’s get started! Update 16-May-2015: Thanks to Yuval Merhav and Oliver Keyes for their suggestions which I’ve incorporated into the post. Update 28-May-2015: Thanks to Dan Steinberg (yes, the CART expert!) What does it do? Wait, what’s a classifier? What’s an example of this?
Now: Given these attributes, we want to predict whether the patient will get cancer. And here’s the deal: Using a set of patient attributes and the patient’s corresponding class, C4.5 constructs a decision tree that can predict the class for new patients based on their attributes. Cool, so what’s a decision tree? The bottomline is:
Visual thinking. Mind Mapping. PMI webinars for PDUs. Consulting. Project management. Excel Templates, Calendars, Calculators and Spreadsheets by Vertex42. Become more productive. The Software Process Dashboard Initiative. Many entry points, one purpose. To create a more inclusive and diverse nonprofit community. Pragmatic Marketing, world's most popular product management training. Work. Infographs. Beautiful web-based timeline software. 10 Awesome Tools To Make Infographics. Advertisement Who can resist a colourful, thoughtful venn diagram anyway?

In terms of blogging success, infographics are far more likely to be shared than your average blog post. This means more eyeballs on your important information, more people rallying for your cause, more backlinks and more visits to your blog. In short, a quality infographic done well could be what your blog needs right now. Designing An Infographic Some great tips for designing infographics: Keep it simple! Ideas for infographic formats include: Timelines;Flow charts;Annotated maps;Graphs;Venn diagrams;Size comparisons;Showing familiar objects or similar size or value. Here are some great tutorials on infographic creation: Creating Your Infographic Plan and research.If required, use free software to create simple graphs and visualisations of data.Use vector graphic software to bring these visualisations into the one graphic. Free Online Tools For Creating Infographics Stat Planet Hohli Creately New York Times Many Eyes.
Excel Dashboards - Templates, Tutorials, Downloads and Examples. Dashboard reports allow managers to get high-level overview of the business.
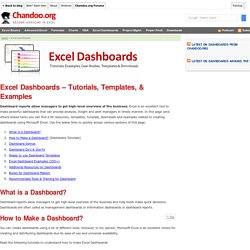
Excel is an excellent tool to make powerful dashboards that can provide analysis, insight and alert managers in timely manner. In this page (and others linked here) you can find a lot resources, templates, tutorials, downloads and examples related to creating dashboards using Microsoft Excel. Use the below links to quickly access various sections of this page. What is a Dashboard? Dashboard reports allow managers to get high-level overview of the business and help them make quick decisions. How to Make a Dashboard? You can create dashboards using a lot of different tools.
Read the following tutorials to understand how to make Excel Dashboards: Creating KPI Dashboards in Excel [6 part tutorial] In this 6 part tutorial, you will learn how to create a KPI (Key Performance Indicator) Dashboard ground up using MS Excel. Flowchart Guide ( Complete Flowchart Tutorial with Examples ) Hello!
This is the blog. Creately helps you draw beautiful diagrams suprisingly fast! Learn More Hide this This is the only Flowchart guide you will ever need. History of Flowcharts Flowcharts were introduced by Frank Gilberth in 1921, and they were called “Process Flow Charts” at the beginning . Flowchart Symbols Meaning Flowchart Symbols. Infographics & Data Visualizations. Powerpointing Templates. DebateGraph.