Infographics. What is SEO? What is SEO? Search engine optimization (SEO) is a process that includes a few steps aiming at improving the rank on the Search engine results page (SERP) and visibility of a website on search engines such as Google and Bing. As opposed to Search Engine Marketing (SEM) which uses paid services (text ads and banners) to improve visibility, SEO aims at improving it through organic search without having to pay any fees to search engines. If you’re not sure about some terminology, use this page .
SEO services started in the mid 90′s when the first few search engines started becoming popular, all you could do back then is submit your website to a bunch of those search engines and wait for results to appear. The process now is more thorough and complicated than it was more then 10 years ago, it includes lots of various steps and requires lots of patience depending on your product, audience and competition. Huge Infographics Design Resources: Overview, Principles, Tips and Examples. Design Imagine what would happen if you were speeding on a highway, and trying to read a traffic sign that contains too much information, would you be able to read the information exactly?

Compare if you were just seeing a place name, a mileage, or an arrow-sign, which one would be more effective for you? Well, that’s just a simple instance. Simply due to the unclear information given, anyone who sees and reads it could miss the important message on it. Top 10 Cities To Buy Vs Rent. Refinance-mortgage. Apple’s 300,000+ tore apps. What can you say about Apple?
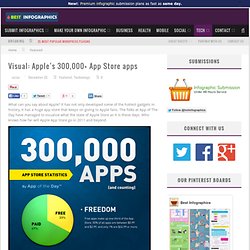
It has not only developed some of the hottest gadgets in history, it has a huge app store that keeps on giving to Apple fans. The folks at App of The Day have managed to visualize what the state of Apple Store as it is these days. Who knows how far will Apple App Store go in 2011 and beyond. Some of the takeaways from this illustration: 300,000 apps and counting, as of December 7th, 2010average price for all apps: $2.43number of unique developers: 62,126top categories: books, games, entertainment, educationpaid vs. free: 67% vs. 33% Sources: FastCompany P.S. any App Store predictions for 2011?
Facebook Photo Trends. There was a time that people didn’t even think about sharing their photos online.
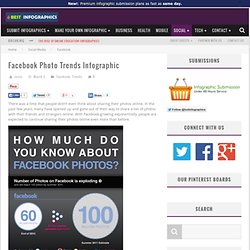
In the past few years, many have opened up and gone out of their way to share a ton of photos with their friends and strangers online. With Facebook growing exponentially, people are expected to continue sharing their photos online even more than before. As the above infographic by Pixable demonstrates, old and young people share their photos online. Graphic Designer’s Roadmap. So you have finally made it as a graphic designer?
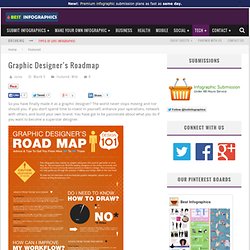
The world never stops moving and nor should you. If you don’t spend time to invest in yourself, enhance your operations, network with others, and build your own brand. Mobile’s Influence on Shopping. There was a time when people relied solely on their home or work computers to do shopping and other things online.
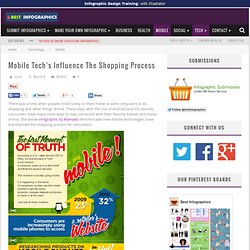
These days, with the rise of Android and iOS devices, consumers have many more ways to stay connected with their favorite brands and stores online. The below infographic by Momads demonstrates how mobile technologies have transformed the shopping process for consumers: As you can see above, people are using their phones to research products, search for coupons, and even scan barcodes. We haven’t even begun yet to scratch the surface here. Noob Guide To Online Mrkting. Have you ever wondered what it would take to become a master in online marketing?
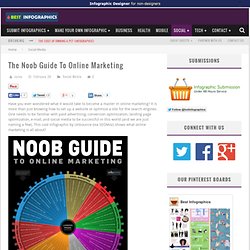
It is more than just knowing how to set up a website or optimize a site for the search engines. One needs to be familiar with paid advertising, conversion optimization, landing page optimization, e-mail, and social media to be successful in this world (and we are just naming a few). Consumer Shopping Habits {Infographic} The Internet has changed the way we shop these days.
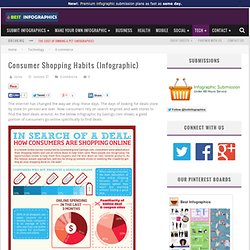
The days of looking for deals store by store (in person) are over. Now consumers rely on search engines and web stores to find the best deals around. As the below infographic by Savings.com shows, a good portion of consumers go online specifically to find deals. Credit: Savings.com Over 39% of consumers shop at least once a month online. 93% of consumers shop at least once a year, which is quite impressive. SoTech_Infographic. 10 Outstanding Social Media Infographics. Nobody has time to read anymore, right?

Every day we are all inundated with more and more information overload coming from credible and yet to be verified sources. Where can Internet users find relief? Answer: the infographic. Infographics are a wonderful mix of key data and visualization that can really bring the message home if put together correctly. Infographic of the Day: The 28 Flavors of Online Conversation in 2010. The Conversation Prism, an exhaustive encyclopedia of all the various sites offering online dialogue, has just been released in an updated version for 2010.
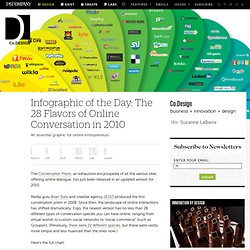
Media guru Brian Solis and creative agency JESS3 produced the first conversation prism in 2008. ConversationPrism_Solis_Jess3_OnlineConversations_LARGE.jpg (JPEG Image, 1300x1660 pixels) - Scaled (35. The Business of Facebook. Infographic of the Day: The World Lives On Facebook. Infographic: The NewsScape – 8 sources of value creation in a post-channel media world. Resume infographic. OUR SERVICES - Infographics. Infographic Elements and Template - Infographics. Cool Infographics - Blog. Infographics Showcase - Data Visualization.
Transparency. So What If You Don't Sleep Enough? How many times have you told yourself (especially when you're up at 2 a.m. on a Sunday night): "Eh, it's just sleep.
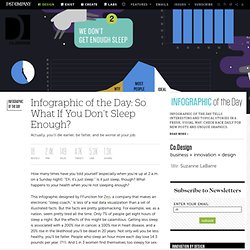
" Is it just sleep, though? What happens to your health when you're not sleeping enough? This infographic designed by FFunction for Zeo, a company that makes an electronic "sleep coach," is less of a real data visualization than a set of illustrated facts. But the facts are pretty gobsmacking. For example, we, as a nation, seem pretty tired all the time: Only 7% of people get eight hours of sleep a night. Infographics. Infographics can change the way we learn, the way we see information put in front of us. They help us digest that information and leads us to draw important conclusions more swiftly. After doing a little research online I was able to discover 10 gorgeous infographics on education that do more than simply show information, they relay it in a really potent and amazing way.
Edit: If you liked this post, you might also like our 22 Mind-Blowing Infographics on Education, too! 1. Education 2.0 – Social Networking & Education 2. Why Apples Are Better Than Oranges [Infographic]