
Kushal Veer Singh
PhD student in JNU, India
CMSC 451 Selected Lecture Notes. [syllabus] | [lecture notes] | [HW1-6,Q1] | [HW7-10,Q2,F] | [project] [simulators/parsers] | [language definitions] | [automata definitions] | [computable definitions] Note that this file is plain text and .gif files.
The plain text spells out Greek letters because old browsers did not display them. Outer loop variable in nested R foreach loop. Publications - Achuthsankar S. Nair - Official Website. Daniel M. Romero. Daniel M. Romero. [R-pkgs] igraph 0.6 released. R - extract negative values from a column. Covariance and Correlation. Loading web-font TeX/Math/Italic \newcommand{\var}{\text{var}} \newcommand{\sd}{\text{sd}}\newcommand{\cov}{\text{cov}}\newcommand{\cor}{\text{cor}}\newcommand{\mse}{\text{mse}}\renewcommand{\P}{\mathbb{P}}\newcommand{\E}{\mathbb{E}} \newcommand{\R}{\mathbb{R}} \newcommand{\N}{\mathbb{N}}\newcommand{\bs}{\boldsymbol} Recall that by taking the expected value of various transformations of a random variable, we can measure many interesting characteristics of the distribution of the variable.
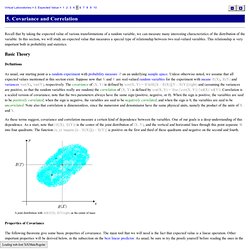
In this section, we will study an expected value that measures a special type of relationship between two real-valued variables. This relationship is very important both in probability and statistics. Basic Theory Definitions As usual, our starting point is a random experiment with probability measure \P on an underlying sample space. Calculus and Probability 3. 3.
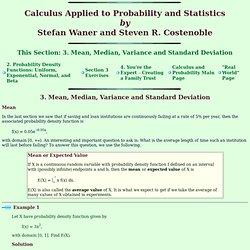
Mean, Median, Variance and Standard Deviation Mean In the last section we saw that if saving and loan institutions are continuously failing at a rate of 5% per year, then the associated probability density function is f(x) = 0.05e. Terminology - Differences between variable and variate. Using Netvizz & Gephi to Analyze a Facebook Network. This post was originally featured on published on May 6th, 2010.
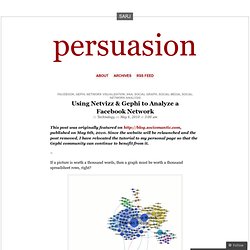
Since the website will be relaunched and the post removed, I have relocated the tutorial to my personal page so that the Gephi community can continue to benefit from it. If a picture is worth a thousand words, then a graph must be worth a thousand spreadsheet rows, right? A Facebook network rendered in Gephi Okay, maybe not, but for practitioners and researchers alike, data visualization can reveal insights that aren’t always obvious from looking at the raw data, no matter how well organized it may be.
Psychological Statistics. Forrest Young's Notes Copyright © 1999 by Forrest W.
Young. Forrest Young and Warren Sarle gathered the following judgments of preference for a set of automobiles from the staff of a large local statistical software house in 1982. The data are judgments, on a scale of 0-10 of the preference the judge has for the automobile (0 = no preference; 10 = maximum preference). Altogether, there were 25 subjects and 17 Automobiles. Note that for preference data the variables correspond tot he judges and the observations to the Automobiles. STAT 505 - Applied Multivariate Statistical Analysis. Printer-friendly version Dispersion: Variance, Stanard Deviation A variance measures the degree of spread (dispersion) in a variable’s values.
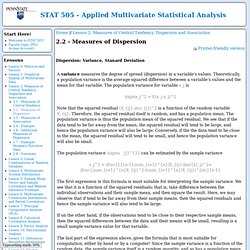
Theoretically, a population variance is the average squared difference between a variable’s values and the mean for that variable. Untitled. Ordination in R This page covers the R functions to perform multivariate ordination, including some methods beyond the default biplots for displaying your results graphically.
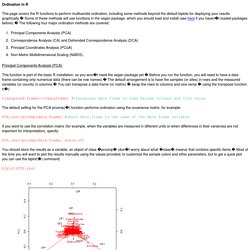
Some of these methods will use functions in the vegan package, which you should load and install (see here if you havent loaded packages before). The following four major ordination methods are covered: Install R package without root access(on Linux) R is a nice compannon for stataitical people.From time to time, I have to install various packages to accomplish some tasks.

At my desktop (linux server), I have the root access, the installation is pretty simple, R packages can be downloaded here [Date order] [Name ordered] Getting a subset of a data structure. Problem You want to do get a subset of the elements of a vector, matrix, or data frame.
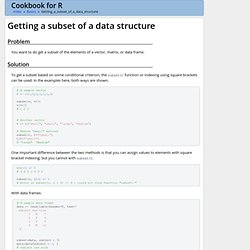
Solution To get a subset based on some conditional criterion, the subset() function or indexing using square brackets can be used. In the examples here, both ways are shown. SNAP: Papers. Tcomp5.html. Contents Context-Free Grammars We have seen that all regular languages, even those containing an infinite number of strings, can be defined using REs with a finite number of terms.
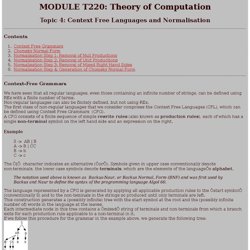
Non-regular languages can also be finitely defined, but not using REs. The first class of non-regular languages that we consider comprises the Context Free Languages (CFL), which can be defined using Context Free Grammars (CFG). A CFG consists of a finite sequence of simple rewrite rules (also known as production rules ), each of which has a single non-terminal symbol on the left hand side and an expression on the right. What is the difference between Unix and DOS. Unix usually refers to a family of operating systems that are similar in function or descendants of the original Unix operating system developed at AT&T Bell Laboratories. This includes a large portion of modern operating systems, including: All Linux distributions (Red Hat, SuSE, Fedora, Debian, etc.)BSDs (FreeBSD, NetBSD, OpenBSD, DragonflyBSD, Mac OS X) Solaris HP-UXAIX Unix-like systems are multi-user and multiprocessing operating systems; that is, more than one user can be using the machine at one time, and each user can run multiple processes, or programs.
DOS v UNIX. This document aims to briefly outline the differences and similarities between UNIX and DOS (MS-DOS, DR-DOS etc.). This is so that newcomers to UNIX can get started quicker if they already know a little about DOS. For more information on specific commands, consult the UNIX on-line manual pages. For further information about UNIX in general, read UNIXhelp for Users. Contents 1. Number of Users. Breathing, Breathing Exercises, Techniques and Breathing for Anxiety. Linux Command Reference. R - Assigning results of a for loop to an empty matrix. ArsDigita University Curriculum. About the Curriculum The curriculum was modeled on the undergraduate CS program at MIT.
Several of the courses were straightforward adoptions of MIT courses. A few were specifically designed for the program, which was roughly in line with the ACM's 2001 Model Curricula for Computing. The process of accreditation (ACM or CSAB/ABET) would have been pursued if the program had continued. Algorithms. Untitled. CSC444 Oct02 slide version single file version. Installation - How to install a .tar.gz (or .tar.bz2) file. Rmr2/docs/tutorial.md at master · RevolutionAnalytics/rmr2. What Is a Virtual Machine? [MakeUseOf Explains] Virtual machines allow you to run other operating systems within your current operating system – the operating systems will run as if they’re just another program on your computer.
Parallel Programming Techniques. Talk like a native speaker - GONNA, HAVETA, WANNA. English Pronunciation - ABCDEFG - How to say letters! Roberto Todeschini. Lesson 5 - Functions. Introduction Last lesson I said that we would delve into purposefull programming. That involves user input, and user input requires a thing called functions. What are functions? Well, in effect, functions are little self-contained programs that perform a specific task, which you can incorporate into your own, larger programs. Machine learning. Theory of Finite Automata. CS 43001 Compiler Construction Course. A Gentle Introduction to ML. How to draw two graphs in one scatterplot? I think that's what you have in mind: import matplotlib, matplotlib.pyplot as plt import numpy def plot_me1(): # generate 25 random triplets of points x, y1, y2 = numpy.random.random((3, 25)) # create figure and axes fig = plt.figure() # split the page into a 1x1 array of subplots and put me in the first one (111) # (as a matter of fact, the only one) ax = fig.add_subplot(111) # plots scatter for x, y1 ax.scatter(x, y1, color='red', marker='o', s=100) # plots scatter for x, y2 ax.scatter(x, y2, color='green', marker='^', s=100) plt.show() plot_me1()
Adding the Python Directory to the path Variable. R: Package Index. Graph Theory: Measures and Indices. Several measures and indices can be used to analyze the network efficiency. Many of them were initially developed by Kansky and can be used for: Expressing the relationship between values and the network structures they represent. Comparing different transportation networks at a specific point in time. Comparing the evolution of a transport network at different points in time. Outside the description of the network size by the number of nodes and edges, and its total length and traffic, several measures are used to define the structural attributes of a graph; the diameter, the number of cycles and the order of a node.
How to calculate centrality measures for a 4 million edge network? R Resources - Daizaburo Shizuka. 3 expressions to improve your conversation skills. Human Language Sentences - Basic Parse Trees, X-Bar Theory & Ambiguity. Course Contents. MapReduce Basics. Slides from today’s Big Data Step-by-Step Tutorials: Infrastructure series and Intro to R+Hadoop with RHadoop’s rmr. VU Lectures.
Mark Newman: Publications. Ent.