
koutahikichi
KOUTAHIKICHI
Creative Director Art Director Photographer クリエイティブディレクター アートディレクター 写真家 http://fotologue.jp/k-hikichi http://vimeo.com/user3886064
Get flash to fully experience Pearltrees
News in German
progkix
ero
jojjkokpl
mopjopjpok
Help
Data Visualization: Modern Approaches « Smashing Magazine
Visualizing Meaning
All 1,943 Cornell Faculty were asked to respond to the following question: Of the many charts (graph, map, diagram, table and ‘other’) you have seen in your life, which has been the most important, remarkable, meaningful or valuable? On the archival paper provided, they were asked to create a copy of the chart and in the remaining space annotate notable attribute of the data and the image, describe what they remembered about first seeing this image and comment on why they chose this image. All other Cornell community members are invited to share their favorite chart by visiting the display table in Mann Library near the reference desk on the first floor. This project has been funded in part by a grant from the Cornell Council for the Arts, New York Foundation for the Arts and a slew of CALS Departments!Whoa. What did I just read? I think most of you know of Freakonomics, but in case you don't, it started as a book in 2005, by economist Steven Levitt and journalist Stephen Dubner. The book examines corners of life (like cheating in sumo) through data. It's a good read. SuperFreakonomics was the follow-up in 2009.
Data Visualization and Statistics
From: mhall@moe.coe.uga.edu (Mike Hall) Thanks to Mohammad Reza Fakhri Ravari (e93rf@efd.lth.se) for typing out the lyrics. Maybe I haven't been looking too hard, but I haven't found any postings of the chords and lyrics put together. Here's my stab at it. I don't have the song, so this needs some error checking. Comments are welcome. ------------------------------------------------------------------------ Creep ===== By Radiohead G When you were here before B Couldn't look you in the eyes C You look like an angel Cm Your skin makes me cry G You float like a feather B In a beautiful weather C I wish I was special Cm You're so fucking special Chorus: G But I'm a creep B I'm a wierdo C What the hell am I doin' here Cm I don't belong here I don't care if it hurts I wanna have control I wanna perfect body I want a perfect soul I want you to notice When I'm not around You're so fuckin' special I wish I was special....
Radiohead - Creep
plp@l@pl@
It’s one thing to read about individual Taliban attacks in WikiLeaks’ trove of war logs . 
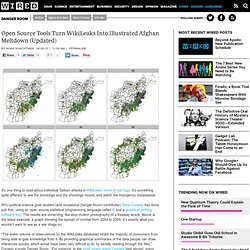
It’s something quite different to see the bombings and the shootings mount, and watch the insurgency metastasize. NYU political science grad student (and occasional Danger Room contributor) Drew Conway has done just that, using an open source statistical programming language called R and a graphical plotting software tool . The results are unnerving, like stop-motion photography of a freeway wreck. Above is the latest example: a graph showing the spread of combat from 2004 to 2009. It’s exactly what you wouldn’t want to see as a war drags on.
WikiLeaks visualizations
Browsing the web of data
xv
Data Art

