
Presidential-debate. (JPEG Image, 1000 × 1466 pixels) - Scaled (68%) How Birth Year Influences Political Views. Knowing how formative events are at different ages, along with the president’s approval rating, allows Mr.

Ghitza and Mr. Gelman to estimate a group’s presidential voting tendencies over time, including during childhood. These preferences are not necessarily how the group voted, because they do not take into account short-term shifts, like Mr. Obama’s wide popularity in 2008. Think of them, instead, as estimates of how a group would vote in an average presidential election. The model works best for white voters. Preferences of whites born in 1941. Mapping the State of the Union. Using natural language processing algorithms followed by hand corrections, we have combed through these 224 State of the Union addresses and identified 16,408 mentions of 1,410 different places.

Plotted on a map, the results reveal how American presidents have seen their nation and their world. We invite you to explore these speeches. Click the arrow on the maps below and observe how the priorities and concerns of our presidents have evolved over time. Pause the map and click on any of the circles to see the passages from each speech that refer to the locations beneath the circles. Then scroll down below the maps and discover how our team of historians interprets what these maps show and what they conceal. AFRICA: Despite America’s deep links to Western Africa, dating back to the slave trade, Africa and African nations are rarely mentioned. CHINA: China’s mentions in the State of the Union follow the sine wave of American interest. Tumblr_n3vqs0d3ME1qk7sffo1_1280.png (PNG Image, 1280 × 859 pixels) - Scaled (80%)
Election-640x2067.png (PNG Image, 640 × 2067 pixels) - Scaled (48%) Understanding-us-aid-policy_53f2865f4f273_w1500.jpg (JPEG Image, 1500 × 8839 pixels) - Scaled (11%) 50-flag-of-the-united-states-01.jpg (JPEG Image, 720 × 3554 pixels) - Scaled (28%) Marijuana_539f320fe1460_w1500.jpg (JPEG Image, 1500 × 970 pixels) Legislative Explorer. Maine Legislature. MoneyWinsCongress-800x800.gif (GIF Image, 800 × 800 pixels)
Abolishing-the-dhs_52b3c10b23b3d_w1500.jpg (JPEG Image, 1500 × 8658 pixels) Obama’s Diverse Base of Support - Interactive Feature. Congress_large.png (2880×4800) Closing-guantanamo-gay_513a33ed5fab8_w1134.png (PNG Image, 1134 × 8716 pixels) Out of Sight, Out of Mind: A visualization of drone strikes in Pakistan since 2004. Drone-attack-trends_5152e1c2ddb79.png (PNG Image, 1200 × 922 pixels) - Scaled (64. Government for the Super Rich. 512 Paths to the White House - Interactive Feature. TheDNAofaSecretServiceAgent_51193578cd8bf.jpg (JPEG Image, 900 × 3750 pixels) Usaid-focus_511d15edda07e.png (1440×1113)
Electoral10-1100.jpg (JPEG Image, 1100 × 848 pixels) Red-state-blue-state_515e5b8deac6d_w1134.jpg (JPEG Image, 1134 × 777 pixels) Us-senate-voting-similarity-networks_524c14c74f83a.png (PNG Image, 2194 × 1550 pixels) - Scaled (43. Minority-population-trends_511d238a6aff3.jpg (JPEG Image, 700 × 1391 pixels) Presidential-initiatives_51a765dfd6e47.png (PNG Image, 1600 × 1236 pixels) - Scaled (55. Five-ways-americans-are-bullied-by-the-government_5123a608eae32.png (PNG Image, 975 × 3438 pixels) 2012 Election Results vs Education Level. No upside – Renee DiResta. A map of American state stereotypes, generated by Google autocomplete.
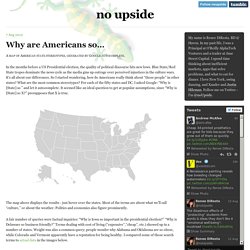
In the months before a US Presidential election, the quality of political discourse hits new lows. Blue State/Red State tropes dominate the news cycle as the media gins up outrage over perceived injustices in the culture wars. It’s all about our differences. So I started wondering, how do Americans really think about “those people” in other states? What are the most common stereotypes? The map above displays the results - just hover over the states. A fair number of queries were factual inquiries: “Why is Iowa so important in the presidential election?”
The qualitative searches were most interesting to me. Boring. The single most common result of all was "boring,” which appeared for 18 states with no particular regional concentration. State pride! Only a few states returned suggested results for demonym queries. Anyway, I thought the results were interesting…so there they are. Leftright_US_1416.gif (1415×1022) US Health Care Spending: Who Pays? The-rising-price-of-american-democracy_503bd7ebbb236.jpg (1800×4500) StrangeSignsTheEconomyIsImproving_4fa0428253f57.jpeg (900×1892) Acting-presidents_50ca432b6b4b3.jpg (2479×4421)