

Getting Started With QGIS: Open Source GIS. Quantum GIS is an open source GIS desktop software more popularly known as QGIS.
QGIS 1.0 was first released in January of 2009 although development on the software began back in 2002 by Gary Sherman with the first versions of the software intended as a GIS data viewer for PostGIS. QGIS is increasingly becoming a viable alternative to commercial GIS desktop software options such as Esri’s ArcGIS suite of GIS software due to its user friendly interface and user support resources including an active user forum. QGIS is a volunteer driven project that is licensed under the GNU General Public License. Built using C++, this open source GIS software can be downloaded for free, and runs on Linux, Unix, Mac OSX, and Windows operating systems. Working with Raster Data — QGIS User Guide 1.7.4 documentation. QGIS Raster to vector and Change projection. —Contribute to this tutorial by completing one section welcome !
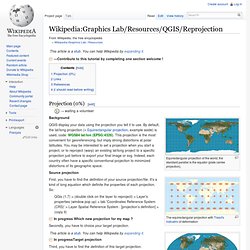
Projection (0%)[edit] → waiting a volunteer Equirectangular projection of the world; the standard parallel is the equator (plate carrée projection). Background. Opening raster files. QGIS understands three major forms of data.
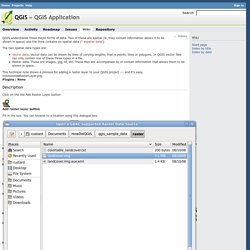
Two of these are spatial (ie, they contain information allows it to be shown in space) and the third contains no spatial data (" aspatial data") The two spatial data types are: Vector data. Vector data can be drawn by lines of varying lengths; that is points, lines or polygons. In QGIS vector files can only contain one of these three types in a file. Raster data. Neogeo ramblings with a Python twist. Occasionally you just need a quick map, and it’s not going to be used for interaction or even necessarily display on the internet (say a Keynote/PowerPoint presentation, for example). We could build it as a Google map, get a gigantic computer monitor and fullscreen the window and take a screenshot, and have it look like every other web map out there – or we can reach into the toolbox of those who are NOT neogeographers and borrow a few things. For me this tool is still qGIS (for Mac check out KyngChaos for binary builds), though there are alternatives like GRASS GIS and TileMill, to name only a couple.
(TileMill is actually designed to create tiles similar to how Google Maps / OpenStreetMap do it, but you can shoehorn it to do “print” maps) Of course, it bears repeating that the results from doing this are not survey quality. QGIS basics for Journalists. QGIS export happens in the print dialog box.
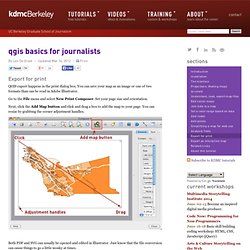
You can save your map as an image or one of two formats than can be read in Adobe Illustrator. Go to the File menu and select New Print Composer. Set your page size and orientation. Next, click the Add Map button and click and drag a box to add the map to your page. You can resize by grabbing the corner adjustment handles. Both PDF and SVG can usually be opened and edited in Illustrator. Create legend with LegendSVG. QGIS Styling Vector Data. Please see Basic Vector Styling for an updated version of this tutorial.
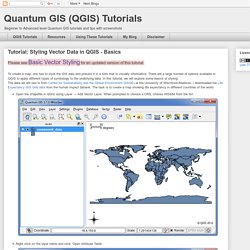
To create a map, one has to style the GIS data and present it in a form that is visually informative. There are a large number of options available in QGIS to apply different types of symbology to the underlying data. In this tutorial, we will explore some basics of styling.The data we will use is from Center for Sustainability and the Global Environment (SAGE) at the University of Wisconsin-Madison. I downloaded the Life Expectancy GIS Grid data from the human impact dataset. The task is to create a map showing life expectancy in different countries of the world.Open the shapefile in QGIS using Layer → Add Vector Layer. We will explore many more options and the Rule-based styling method in a subsequent tutorial. Stamen Maps for QGIS. Stamen’s maps are amongst the most creative and beautiful OpenStreetMap visualizations and it would be great to have them as base maps in QGIS.
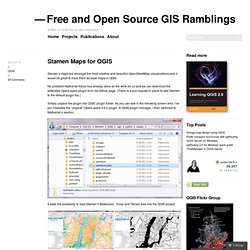
No problem! Nathaniel Kelso has already done all the work for us and we can download the extended OpenLayers plugin from his Github page. (There is a pull request in place to add Stamen to the default plugin too.) Simply unpack the plugin into QGIS’ plugin folder. As you can see in the following screen shot, I’ve put it besides the “original” OpenLayers 0.6.2 plugin.
It adds the possibility to load Stamen’s Watercolor, Toner and Terrain tiles into the QGIS project: QGIS Using Tabular Data. QGIS Working with Attribute Table. Quantum GIS (QGIS) Tutorials. Exporting QGIS to Illustrator. QGIS Server on Ubuntu Step-by-step « Free and Open Source GIS Ramblings. This post summarizes my notes about installing QGIS Server on Ubuntu, adding a QGIS project file to the server and using the WMS in an OpenLayers application.
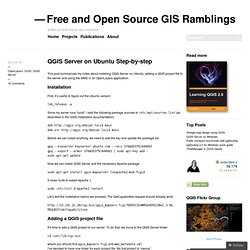
Installation First, it’s useful to figure out the Ubuntu version: lsb_release -a Since my server runs “lucid”, I add the following package sources to /etc/apt/sources.list (as described in the QGIS installation documentation) deb lucid main deb-src lucid main Before we can install anything, we need to add the key and update the package list gpg --keyserver keyserver.ubuntu.com --recv 1F9ADD375CA44993 gpg --export --armor 1F9ADD375CA44993 | sudo apt-key add - sudo apt-get update Now we can install QGIS Server and the necessary Apache package sudo apt-get install qgis-mapserver libapache2-mod-fcgid It never hurts to restart Apache :) sudo /etc/init.d/apache2 restart Let’s test the installation before we proceed.
QGIS Plugin of the Week: Time Manager. QGIS has a lot of plugins, including over 180 that have been contributed by users. If you aren’t using plugins, you are missing out on a lot that QGIS has to offer. I’m starting what I hope to be a regular feature: Plugin of the Week. This week we’ll take a look at Time Manager. Time Manager lets you browse spatial data that has a temporal component. Essentially this includes anything that changes location through time. Wildlife trackingVehiclesStorm centersQGIS users. GDAL: GDAL - Geospatial Data Abstraction Library.