
What Exactly Is Visualization? I love a good visualization.
I’ve always been fascinated by those images that manage to inform and entertain at the same time. From time to time I’ve tried to supply tips and insight to help those interested in creating better visualizations. Some thoughts on visualisation. Data visualization. Data visualization or data visualisation is viewed by many disciplines as a modern equivalent of visual communication.
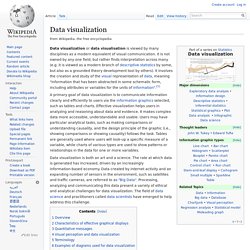
It is not owned by any one field, but rather finds interpretation across many (e.g. it is viewed as a modern branch of descriptive statistics by some, but also as a grounded theory development tool by others). It involves the creation and study of the visual representation of data, meaning "information that has been abstracted in some schematic form, including attributes or variables for the units of information".[1] A primary goal of data visualization is to communicate information clearly and efficiently to users via the information graphics selected, such as tables and charts.
Effective visualization helps users in analyzing and reasoning about data and evidence. Statistical graphics. Statistical graphics, also known as graphical techniques, are information graphics in the field of statistics used to visualize quantitative data. Overview[edit] Exploratory data analysis (EDA) relies heavily on such techniques. They can also provide insight into a data set to help with testing assumptions, model selection and regression model validation, estimator selection, relationship identification, factor effect determination, and outlier detection.
In addition, the choice of appropriate statistical graphics can provide a convincing means of communicating the underlying message that is present in the data to others.[1] Graphical statistical methods have four objectives:[2] Data visualization. GeoHive - Population Statistics.