
Business planning software and tools - StratPad. Free Online Business Plan Writing App. Free, Fast and Easy Business Plan Software. Free Online Business Plan Writing App. Free, Fast and Easy Business Plan Software. Graphical Project Management Process Template - Office Timeline. Planes y precios. ¿Qué pasa si dejo de pagar la cuota mensual?
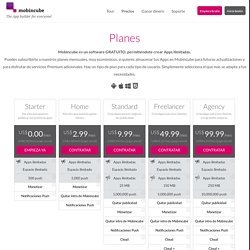
Si por algún motivo decides dejar de pagar o hay algún error con la transacción que impida el cobro de tu cuota, te avisaremos dándote un tiempo para solucionar el problema con el pago. Si no pagas la deuda dentro de los primeros 7 días del próximo ciclo de facturación, tu cuenta se reducirá hasta el plan Starter, causando estos efectos: Tus Apps publicadas seguirán funcionando.Los servicios Premium serán desactivados de tus apps.Si los recursos de tus Apps exceden 5MB, no podrás republicar ninguna App hasta que borres los recursos suficientes para estar por debajo del límite.No podrás actualizar los recursos del Cloud, pero éstos seguirán funcionando.
¿Qué pasa si necesito más espacio en disco? Siempre puedes mejorar tu cuenta a un plan mensual superior para obtener mayor espacio en disco para alojar los recursos de tus apps. ¿Que significa el límite mensual de las notificaciones push? Cada plan mensual tiene un límite distinto de envíos push. How To Make An App: App Maker for Android, iPhone, iPad. UberVU Reviews. Products Search: social media. Global Project Management with Online Gantt Chart. Make a Basic Gantt - Video Transcript Gantt Charts allows us to visualize and see how project tasks relate to each other and progress over time.
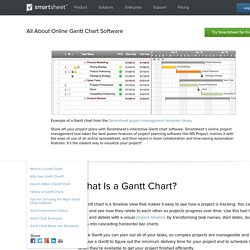
There are a couple of ways to start a project with a Gantt view. You can open a project template, import an existing MS project, Google spreadsheet or Excel file, or start a new project sheet that is preset for Gantt viewing. We'll go ahead and open this Q4 Product Launch. To open the Gantt, click the 'Gantt View' button on the toolbar. We can adjust the width of the Gantt by dragging it's edge. At the top-left side of the Gantt are buttons to zoom in or out to weekly, monthly, quarterly and yearly perspectives.
The Gantt shows workdays in white, non-workdays in grey, and holidays in light pink. The current day is marked with a black dash line along the right side of the column. Simply enter the start date and the task will appear in the Gantt as a colored bar for 1 day. Here we will enable a rule for past due items to be marked in red in the Gantt. Beautiful web-based timeline software. Early history of China. Ghana's Timeline - Back To Ghana. For Schools. Flip your classroom with mind mapping Flipping the classroom allows you to reach all of your students, while enabling them to receive knowledge at home, in a structured manner, at their own pace, and engage them in classroom activities that clarify and build up what they've learned.

Mind mapping in Mindomo will help you prepare your lessons, explain complex concepts and create lively tutorials. Also, using Mindomo in the classroom with your students will help you capture and retain their focus on key concepts, as you assist them in expanding their learning. Learn to mind map and acquire knowledge at the same time by using our innovative smart maps Smart mind mapping is our latest innovation.
Smart maps are interactive, partially filled-in mind maps, that guide students through questions and suggestions to develop and learn more about various concepts. Homepage. Dipity - Find, Create, and Embed Interactive Timelines. Preceden: Timeline Maker & Timeline Generator. Custom QR Code Generator - Free & Premium plans - Unitag. Free Visual QR Code Generator. Vizualize.me: Visualize your resume in one click. Create and share visual ideas online. Infographics & Data Visualization. Piktochart- Infographic & Presentation Tool.
Create Infographics. Venngage - Think with your eyes. Timeline JS - Beautifully crafted timelines that are easy, and intuitive to use. InFoto Free. Photo Stats – infographic creator for your iPhone photos. Software de Mind Mapping - Crear Mind Maps en línea. 20+ Tools to Create Your Own Infographics. A picture is worth a thousand words – based on this, infographics would carry hundreds of thousands of words, yet if you let a reader choose between a full-length 1000-word article and an infographic that needs a few scroll-downs, they’d probably prefer absorbing information straight from the infographic. What’s not to like? Colored charts and illustrations deliver connections better than tables and figures and as users spend time looking back and forth the full infographic, they stay on the site longer. Plus, readers who like what they see are more likely to share visual guides more than articles. While not everyone can make infographics from scratch, there are tools available on the Web that will help you create your very own infographics.
In this article, we’re listing more than 20 such options to help you get your messages across to your readers, visually. Read Also: The Infographic Revolution: Where Do We Go From Here? What About Me? “What About Me?” Vizualize.me Piktochart easel.ly.