
Tools for making latex tables in R. Cheatsheet - 11 Steps for Data Exploration in R (with codes) Introduction If you wish to build an impeccable predictive model, trust me, neither any programming language nor any machine learning algorithm can award it to you unless you perform data exploration.
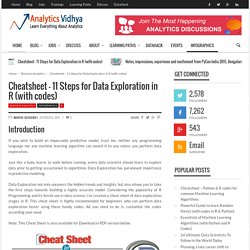
Just like a baby learns to walk before running, every data scientist should learn to explore data prior to getting accustomed to algorithms. Data Exploration has paramount importance in predictive modeling. Data Exploration not only uncovers the hidden trends and insights, but also allows you to take the first steps towards building a highly accurate model. The Mod Function. What has modular arithmetic got to do with the real world?
The answer any experienced programmer should give you is "a lot". Not only is it the basis for many an algorithm, it is part of the hardware. Many programmers are puzzled by the mod, short for modulo, and integer division functions/operators found in nearly all languages. Modular arithmetic used to be something that every programmer encountered because it is part of the hardware of every machine. You find it in the way numbers are represented in binary and in machine code or assembly language instructions. Once you get away from the representation of numbers as bit strings and arithmetic via registers then many mod and remainder operations lose their immediate meaning so familiar to assembly language programmers. You may not meet the mod function or operator in the course of learning to program, but once you start to write real code you will certainly meet it. Passive and Active If you didn't then it's not too late. Clock arithmetic.
Look for These 7 Characteristics Before Hiring a Data Scientist. Data is being collected in droves, but most of the time, people don’t know what to do with it.
That’s why data scientists are hot commodities in the startup world right now. CheatSheet on Data Exploration using Pandas in Python. If some one would ask me to mention 2 most important libraries in Python for data science, I’ll probably name “pandas” and “scikit-learn”.
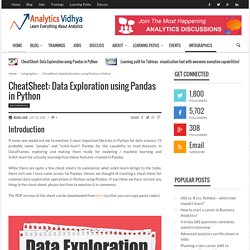
Pandas for the capability to read datasets in DataFrames, exploring and making them ready for modeling / machine learning and Scikit-learn for actually learning from these features created in Pandas. While there are quite a few cheat sheets to summarize what scikit-learn brings to the table, there isn’t one I have come across for Pandas. Hence, we thought of creating a cheat sheet for common data exploration operations in Python using Pandas.
If you think we have missed any thing in the cheat sheet, please feel free to mention it in comments. The PDF version of the sheet can be downloaded from here (so that you can copy paste codes) Running Randomized Evaluations: A Practical Guide. Big Data Made Simple - One source. Many perspectives. 10 Charts About Sex. This was one of the first infographics ever made: Later remembered as "the map that made a nation cry", it depicts Napoleon's failed invasion of Russia in 1812.

The wide tan swath shows his Grande Armée, almost half a million strong, marching East to Moscow; the black trickle shows the few who straggled back. It's an elegant fusion of geography, time, and temperature into a single statement of military disaster. Of course, using modern tools of analysis, like circles and the color blue, we can get an even clearer picture of history: It is our goal today to create graphics of similar concision and power, but about something more useful than war—sex. All the data below, even the most personal stuff, has been gleaned from real user activity on OkCupid. Other than the unifying theme, sex, there's no big point or thesis to this post: just comparisons, correlations, and quirky trends. Chart #1 We found this by crossing the match questions Do you like to exercise? Chart #2 Chart #3 Charts #4 & #5 Duke. From Deconstruction to Big Data: How Technology is Reshaping the Corporation.
Evans affirms that we are undergoing a re-acceleration of technological change despite the global recession and that something sudden and dramatic is happening.
One important aspect of this is how Big Data is reshaping business, and transforming internal organization and industry architecture. He goes on to explain that two information technology drivers are reshaping internal organization: business strategy and the structures of industries. The first is deconstruction of value chains: the breakup of vertically-integrated businesses, as standards and interoperability replace managed interfaces. And the second is polarization of the economies of mass, meaning that in some activities, economies of scale and experience are evaporating, while in others they are intensifying. He doesn’t consider Big Data as an isolated or unique phenomenon, but rather as an example of a wider and deeper set of trends reshaping the business world. Driving Marketing Results with Big Data.
For marketers trying to maximize their return on investment, predictive analytics based on big data is an exciting new tool.
In the digital world, predictive analytics based on big data holds the promise of creating a detailed view of what works, providing guidance that has never been available before for the fine tuning of advertising campaigns. The promise of big data analytics is that marketers can analyze thousands of points of information about the digital activity of the purchaser—stripped of personally identifiable information—and combine it with their knowledge of television, radio, billboard, and print campaigns to tailor marketing messages and, ultimately, improve return on investment (ROI). With analysis, the numbers show how much lift each data point provided for each ad in each channel. With that data, marketers can make better decisions about how to allocate their ad budgets.
Indeed, the analytics themselves will identify the smart choices.