
Food Industry Information. Please feel free to add this infographic to your blog or website, and share on social networks.
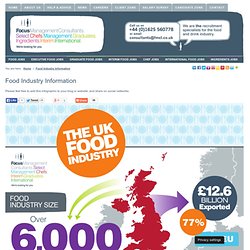
Embed this on your site: <div align="center" style="font-size: 11px;"><a href=" src=" alt="food-industry-information" border="0"></a><br><a href=" Industry Information</a></div> How many food and drink manufacturing businesses operate in the UK? How much does the UK food industry turnover? How much does the UK food industry export, and how much of that goes to the EU? Food manufacturing is the largest manufacturing sector in the UK, but how much is that? Virtual Active — Welcome. The Food People. View all infographics » When you think of street food, do you think of greasy burgers from a battered van or Goan seafood from a modern trailer?
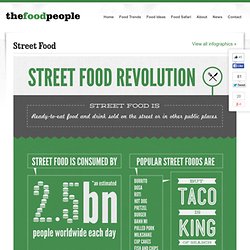
We’re witnessing a street food revolution and thefoodpeople have been keeping a close eye on this global food trend. The change in street food over the last decade has been dramatic – from traditional food carts to mobile hi-tech kitchens – and it continues to evolve, becoming ever more sophisticated, with the choice of foods growing all the time.
The Environmental Impact Of Wasted Food. We wrote last week about our giant food waste problem.
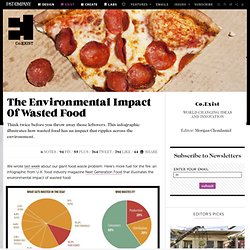
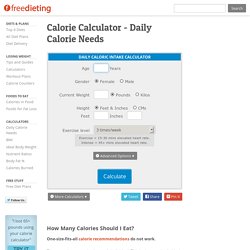
Here’s more fuel for the fire: an infographic from U.K. food industry magazine Next Generation Food that illustrates the environmental impact of wasted food. The infographic includes some remarkable statistics taken from a peer-reviewed study about food waste in the U.S. Waste has increased by about 50% since 1974, and now accounts for nearly 40% of all food produced in the U.S. Across the supply chain, we lose 1,400 kilocalories per head per day, or 150 trillion kilocalories each year (kilocalories are the "calories" you see on the back of food packs). Food waste accounts for a quarter of the freshwater supply, and 300 million gallons of oil a year. It wouldn’t be so bad if we did something with the waste other than throwing it in landfills, where it produces methane, a powerful greenhouse gas. Calorie Calculator - Daily Caloric Needs. <div class="alert">Hey!
You have JavaScript disabled on your browser. TOOLS. Mind Map Art: Showcasing the World's Finest Mind Maps. Creative Thinking. Первый российский информационно-аналитический портал о мастерстве публичных выступлений и презентаций. Project of How → Methods. Feedback Group members.
Infographics. Infographed. Vizualize.me: Visualize your resume in one click. Infographics from KISSmetrics. 10 Free Tools to Create Infographics. Infographics are fun, creative, data-visualization tools that can help businesses express facts and statistics about their products, markets, and services.
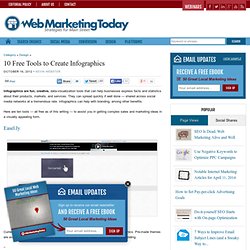
They can spread quickly if well done — shared across social media networks at a tremendous rate. Infographics can help with branding, among other benefits. Here are ten tools — all free as of this writing — to assist you in getting complex sales and marketing ideas in a visually appealing form. Easel.ly Easel.ly Currently in Beta, Easel.ly provides an intuitive interface to design and create infographics.
Infogr.am If you have trouble making spreadsheet data turn into visually appealing graphs and charts, this may be the tool for you. Hohli Hohli If you simply need to present data in attractive charts, perhaps for inclusion in an infographic, Hohli provides bar, Pie, Line, and Venn diagram templates for you to work your data into. D3 is more of a desktop tool, and primarily aimed at developers. Париэль-Принт. Рекламно-производственная компания полного цикла "Париэль Принт". RealtimeBoard.
BOOKS. Человек в современном индустриальном обществе, обществе модерна. Проблема Генезиса. Будущность. Секуляризация. Освобождение. Индуализация. Абстракция. CHANGE. Проекты - Design Thinking Lab. StickK − Change Starts Now. _portfolio » YOUFIRST. Inspired by the February 20th flood in Madeira Island in 2010, our team of 5 Service Design Students came up with an app that tackled emergency situations in a broad range of stages from early detection to emergency response once the disaster strikes. YouFirst is an app that feeds from crowd-sourced data input to inform other users (including victims, rescuers and experts) in real-time about the conditions in the area where the information is being sent. YouFirst also works as a decision support tool for its users, since the system provides the user with information that is individual and context-relevant. YouFirst Communication Video Setup Stage Yellow Alert Stage Red Alert Stage The team started off by making a Territory Map that allowed us to decide where to focus our research on based on our skills and problem-solving abilities, thus deciding that our most valuable contribution could be in Public Response and Rescue.
Prospectus. At Ravensbourne, your professional career starts on your first day.
From the moment you step onto our award-winning campus, we'll stimulate you to join thousands of our graduates who are pushing the boundaries in digital media and design. 2009 - Helen Hamlyn Centre. Sponsored by Sanctuary Care Challenge 2009 publication information and download Sedentary Lives Design briefWe are increasingly leading sedentary lives - from couch potato kids who are glued to their computers, office workers who barely leave their desks and long distance truck drivers who spend long hours behind the wheel, through to the elderly who live in supported care schemes at the end of their lives. Getting people moving is a massive challenge. Inclusive design proposals were invited from member firms of the Design Business Association to address any one of a range of sedentary scenarios. Sian Jarvis, Director of Communications at the Department of Health (DOH) and initiator of the influential Change 4 Life campaign, was keynote speaker at the awards event on 5 March.
Five design teams were shortlisted for the DBA Inclusive Design Challenge 2009. The verdict The 2009 DBA Inclusive Design Challenge Award went to Matter for 'mo-dynamic seating' - a radical redesign of the cushion.