
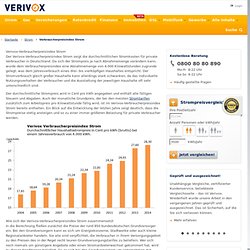
Strompreise Deutschland - Strompreis Atlas von StromAuskunft.de. Autor: Dr.

Jörg Heidjann Die Strompreise in Deutschland sind regional sehr unterschiedlich und von verschiedenen Faktoren abhängig. Zum einen hängt der Preis vom Wohnort der Verbraucher ab. Aber auch der Stromanbieter und die Tarifart entscheiden über den Strompreis. Der Endkunden Strompreis setzt sich aus verschiedenen Komponenten zusammen. Strompreise mit dem Stromrechner vergleichen Mit dem Stromrechner können Sie schnell und einfach die Strompreise an Ihrem Wohnort vergleichen. Der implementierte Stromrechner wurde von der Stiftung Warentest in der Ausgabe 09/2008 mit sehr gut getestet. Tarife werden berechnet... Strompreise in Deutschland, Aufgeteilt nach Bundesländern Jährliche Stromkosten in Deutschland nach Bundesländern bei einem Jahresverbrauch von 3500 kWh Regionale und lokale Strompreise Strompreis Atlas zeigt regionale Unterschiede Der Strompreis - Atlas visualisiert deutschlandweit die aktuellen monatlichen Strompreise für alle Städte, Landkreise und kreisfreie Städte an.
Untitled. GME - Statistics & monitoring - Electricity Market - comparison of European Exchs. Global Energy Observatory: Information on Global Energy Systems and Infrastructure. Energy Price Index. Entsoe.net – the transparency platform on Electricity in Europe. Verbraucherpreisindex Strom: Preisentwicklung für Haushaltskunden. Login Startseite Strom Verbraucherpreisindex Strom Verivox-Verbraucherpreisindex Strom Der Verivox-Verbraucherpreisindex Strom zeigt die durchschnittlichen Stromkosten für private Verbraucher in Deutschland.
Da sich der Strompreis je nach Abnahmemenge verändern kann, wurde dem Verbraucherpreisindex eine Abnahmemenge von 4.000 Kilowattstunden zugrunde gelegt, was dem Jahresverbrauch eines drei- bis vierköpfigen Haushaltes entspricht. Der Stromverbrauch gleich großer Haushalte kann allerdings stark schwanken, da das individuelle Nutzungsverhalten der Verbraucher und die Ausstattung der jeweiligen Haushalte oft sehr unterschiedlich sind. Der durchschnittliche Strompreis wird in Cent pro kWh angegeben und enthält alle fälligen Steuern und Abgaben. Wie sich der Verivox-Verbraucherpreisindex Strom zusammensetzt In die Berechnung fließen zunächst die Preise der rund 850 bundesdeutschen Grundversorger ein. Wettbewerber werden berücksichtigt Kostenlose Beratung Strompreisvergleich kWh/Jahr Mehr erfahren. Enipedia - Enipedia. CARMA - Carbon Monitoring for Action. E-PRTR. Database. MBS Monthly Bulletin of Statistics Online. Market Report & Industry Analysis. Energy market reports are available for 113 countries.
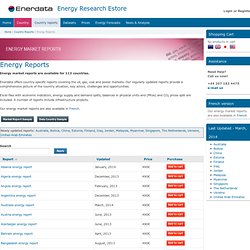
Enerdata offers country-specific reports covering the oil, gas, coal and power markets. Our regularly updated reports provide a comprehensive picture of the country situation, key actors, challenges and opportunities. Excel files with economic indicators, energy supply and demand splits, balances in physical units and (Mtoe) and CO2 prices split are included. A number of reports include infrastructure projects. Our energy market reports are also available in French. Market Report Sample Data Country Sample Newly updated reports: Australia, Bolivia, China, Estonia, Finland, Iraq, Jordan, Malaysia, Myanmar, Singapore, The Netherlands, Ukraine, United Arab Emirates.
Kraftwerke und Verbundnetze in Europa. Interaktive Kraftwerkskarte für regenerative und konventionelle Energien. Electric power transmission and distribution losses (% of output) International Energy Statistics. Statistical Review of World Energy 2010. U.S. Energy Information Administration - EIA - Independent Statistics and Analysis. Global electricity prices: On the up and set to rise. Publications Bookshop. NUS Consulting / Energy Pricing Reports.
CDM Statistics. UNEP Risoe CDM/JI Pipeline Analysis and Database. Electricity for Europe. International Energy Agency Data Services. If this is your first visit, please read the following information and note that you must register before purchasing or accessing any of the Data Services.
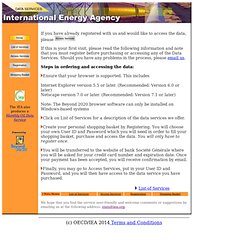
Should you have any problems in the process, please email us. Ensure that your browser is supported. This includes Internet Explorer version 5.5 or later. (Recommended: Version 6.0 or later) Netscape version 7.0 or later. Note: The Beyond 2020 browser software can only be installed on Windows-based systems Click on List of Services for a description of the data services we offer. Create your personal shopping basket by Registering. You will be transferred to the website of bank Société Générale where you will be asked for your credit card number and expiration date. Finally, you may go to Access Services, put in your User ID and Password, and you will then have access to the data service you have purchased. Gas, Power and Carbon News & Market Information. Energy underpins the world we live in.
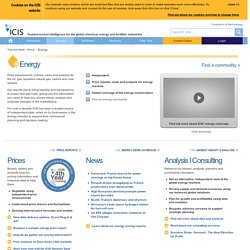
ICIS can help you get better insight into the global energy markets. We offer a joined up view of energy, feedstocks, and downstream supply and demand data, helping to support your transactional and strategic planning decisions. At ICIS we provide price benchmarks, news, analysis and consulting for the global wholesale energy markets. Whether you need forward prices to support your investment decisions; benchmark prices for your purchasing contracts; supply and demand data for your trading activities or independent strategic advice about how long term trends could impact your business… …ICIS offers a range of solutions and expertise to give you a competitive advantage in the marketplace. With over 20 years of experience in the energy markets and over 600 staff based around the world, ICIS gives you accurate information direct from the market.
Independent, Trusted, Global. European Energy Exchange: EEX Startseite. International Energy Agency - Energy Statistics. IEA statistics database. Energy: Energy Market Observation System - European commission. Access to Electricity.