
What Is Indices Trading And How To Make Money Trading Them? - Living From Trading. Indices are one of the best markets to trade.

Their charts are much clearer than forex charts. And you know what? They trend a lot! That makes them perfect for strategies that follow trends. But first, let’s start to understand: What is an index? An Index is just a way of measuring the value of a certain group of stocks. In a very simple way, imagine that you choose a bunch of companies and calculate the average of their shares price. S&P Dow Jones Indices. 18 Best Technical Analysis Software for Stock Trading in India 2020. Over the years, traders and investors have started using trading software for trading purposes.
This software is also used for analysing products like stocks, futures, currencies and options. In the software, you would find multiple modules for not only managing order placement but also assessing profitable ways to invest in a business. Then there are options attached for doing both technical and fundamental analysis as well as performing automated trading. Major Indices — Quotes and Overview. The main stock indices are managed by the exchanges of developed countries.
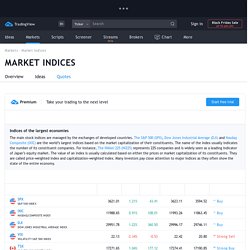
The S&P 500 (SPX), Dow Jones Industrial Average (DJI) and Nasdaq Composite (IXIC) are the world’s largest indices based on the market capitalization of their constituents. The name of the index usually indicates the number of its constituent companies. For instance, The Nikkei 225 (NI225) represents 225 companies and is widely seen as a leading indicator of Japan’s equity market. Top 20 Futures Trading Blogs, Websites & Influencers in 2020. 1.
InsideFutures.com United States About Blog InsideFutures.com was designed for traders like yourself. We strive to be your number-one resource for timely, accurate and useful futures and commodity quotes, charts, technical opinion, trading analysis and other market commentary. Futures & Commodity Quotes, Charts, News, Commentary, Analysis & Education Frequency 21 posts / dayAlso in Commodity Blogs Blog insidefutures.com Domain Authority 48ⓘ ⋅ Alexa Rank 413.3Kⓘ View Latest Posts ⋅ Get Email Contact 2. Chicago, Illinois, United States About Blog The Futures Blog contains articles pertaining to brokerage services, written by our own brokers and editorial team. 3. Boca Raton, Florida, United States About Blog Futures trading education, articles, and strategies. VfxAlert - Signals for binary options. Top 9 Best Stock Market APIs (for Developers in 2020) [78+ Reviewed]
S&P 500 E-Mini Futures Chart — ES Futures Quotes. S&P 500 — short for Standard and Poor's 500, is a United States stock market index based on the market capitalizations of the top 500 companies that have common stock listed on the New York Stock Exchange or NASDAQ.
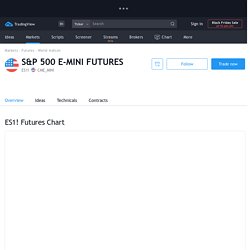
With its headquarters in New York City and dating back to 1860, Standard and Poor's has offices in 23 countries and maintains the SP 500 index. Over $1.25 trillion USD is indexed to Standard and Poor's portfolio of indices, which includes the S&P 500. The S&P 500 index seeks to reflect the status of the whole stock market by tracking the return and volatility of the 500 most commonly held large cap company stocks on the NYSE, capturing approximately 80% of total market capitalization. The 500 companies comprising the SP500 span all major industries and are selected based on their market capitalization, liquidity, ability to be traded, as well as other factors. Zignaly: Best Crypto Trading Bots Platform. 4 Simple Relative Strength Index (RSI) Trading Strategies.
23 July 2018 , Al Hill In this article, we will cover one of the most popular oscillators – the relative strength index (RSI).
You have probably read some general articles on the RSI; however, in this post, I will present four trading strategies you can use when trading. Before we dive into the strategies, let’s first ground ourselves on the RSI indicator and provide you with a few techniques not widely known. Relative Strength Index Definition. Top 7 Market Breadth Indicators for Day Traders. 15 May 2018 , Al Hill Day trading at the end of the day comes down to timing.
Funny how the smaller the time frame you trade, the more accuracy is required of you the trader. I cannot tell you how many times I opened a position 5 minutes too soon or closed a minute early. We are literally talking about seconds here and the difference between a profitable or losing trade. To help improve timing, day traders will heavily rely on time and sales and level 2. For example, if you were long a stock in the Nikkei the night of the 2016 presidential election results came in with Trump as the winner, you were just blindsided. Well, in this article we will cover these market breadth indicators and how you can use them to improve the accuracy of your trading.
Top 7 Market Breadth Indicators for Day Traders It’s not an official Tradingsim post if we do not provide a top 10 list. How Traders Use CCI (Commodity Channel Index) to Trade Stock Trends. How Do Traders Use CCI (Commodity Channel Index) to Trade Stock Trends?
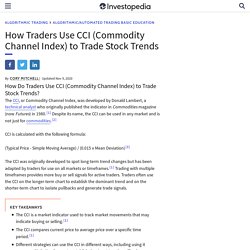
The CCI, or Commodity Channel Index, was developed by Donald Lambert, a technical analyst who originally published the indicator in Commodities magazine (now Futures) in 1980.1 Despite its name, the CCI can be used in any market and is not just for commodities.2 CCI is calculated with the following formula: (Typical Price - Simple Moving Average) / (0.015 x Mean Deviation)3 The CCI was originally developed to spot long-term trend changes but has been adapted by traders for use on all markets or timeframes.1 Trading with multiple timeframes provides more buy or sell signals for active traders.