
MCFC Analytcs. STATA Geek Out – Tables with outreg2. Aside from the very interesting theoretical and political-sociology oriented posts of late, some of us at the UT Austin Soc blog would also like to encourage other types of posts with a more methodological angle.

Since many of us use STATA for statistical work, I thought a series of posts on STATA tips and tricks would be a good place to start our “geek out” and share some time-saving, or just plain cool commands. So here I’m going to give a little bit of sample code for getting tables and graphs out of STATA for a more manageable look at results. When it comes to tables, there are a number of useful programs built in to STATA to export results of regressions and other data. STATA 12 now comes with an improved menu button for exporting certain parts of the raw data to excel. “Tabout” is a useful tool for creating summary excel tables of tabbed data, for example average income by gender, if the data is from a certain country. So, there are several steps to get our neat excel output.
Stata Library: Graph Examples. Welcome to the Institute for Digital Research and Education Institute for Digital Research and Education Home Help the Stat Consulting Group by giving a gift Stata LibraryGraph Examples Stata 8 has a whole new look for the graphs it produces, as illustrated in the graphs below.
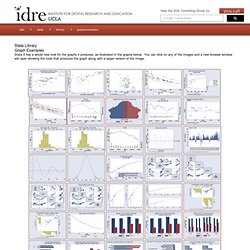
You can click on any of the images and a new browser window will open showing the code that produced the graph along with a larger version of the image. This page was adapted from a page from the Stata Corporation web site and is provided on our site courtesy of, and copyright Stata Corporation. How to cite this page Report an error on this page or leave a comment The content of this web site should not be construed as an endorsement of any particular web site, book, or software product by the University of California. IDRE Research Technology Group High Performance Computing Statistical Computing. Statistical Computing Seminars: Graphics using Stata 8. Statistical Computing Seminars Graphics using Stata 8 The aim of this seminar is to help you increase your skills in creating graphics using Stata.

It will cover scatterplots, scatterplot matrices, bar charts, box plots, dot plots, and regression diagnostic plots. In addition, the seminar will cover the structure of Stata graph commands and many of the common options that they share. 12 help for graph box. Horizontal box plot of variable by values of categorical variable. Stata FAQ: Can I make regression tables that look like those in journal articles? Stata FAQ Can I make regression tables that look like those in journal articles?
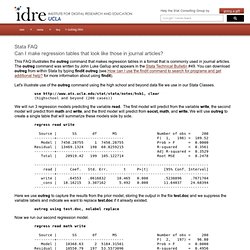
This FAQ illustrates the outreg command that makes regression tables in a format that is commonly used in journal articles. The outreg command was written by John Luke Gallup and appears in the Stata Technical Bulletin #49. You can download outreg from within Stata by typing findit outreg (see How can I use the findit command to search for programs and get additional help? For more information about using findit). Let's illustrate use of the outreg command using the high school and beyond data file we use in our Stata Classes. use clear (highschool and beyond (200 cases)) We will run 3 regression models predicting the variable read.
Here we use outreg to capture the results from the prior model, storing the output in the file test.doc and we suppress the variable labels and indicate we want to replace test.doc if it already existed. Regression with Stata: Lesson 1 - Simple and Multiple Regression. Annotated Stata Output: Regression. Stata Annotated Output Regression Analysis This page shows an example regression analysis with footnotes explaining the output.
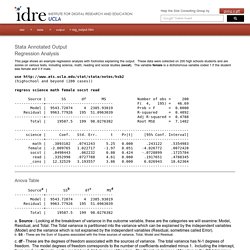
These data were collected on 200 high schools students and are scores on various tests, including science, math, reading and social studies (socst). The variable female is a dichotomous variable coded 1 if the student was female and 0 if male. use (highschool and beyond (200 cases)) regress science math female socst read Source | SS df MS Number of obs = 200 -------------+------------------------------ F( 4, 195) = 46.69 Model | 9543.72074 4 2385.93019 Prob > F = 0.0000 Residual | 9963.77926 195 51.0963039 R-squared = 0.4892 -------------+------------------------------ Adj R-squared = 0.4788 Total | 19507.5 199 98.0276382 Root MSE = 7.1482 ------------------------------------------------------------------------------ science | Coef.
Stata FAQ: How can I create dummy variables in Stata? Stata FAQ How can I create dummy variables in Stata?
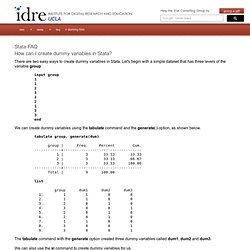
There are two easy ways to create dummy variables in Stata. Let's begin with a simple dataset that has three levels of the variable group: input group 1 1 2 3 2 2 1 3 3 end We can create dummy variables using the tabulate command and the generate( ) option, as shown below. tabulate group, generate(dum) group | Freq. The tabulate command with the generate option created three dummy variables called dum1, dum2 and dum3. We can also use the xi command to create dummy variables for us. Stata Learning Module: Using IF with Stata commands. Stata Learning Module Using IF with Stata commands This module shows the use of if with common Stata commands.
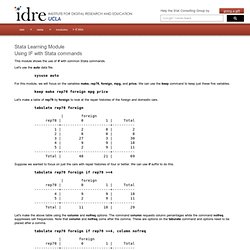
Let's use the auto data file. sysuse auto For this module, we will focus on the variables make, rep78, foreign, mpg, and price. We can use the keep command to keep just these five variables. keep make rep78 foreign mpg price Let's make a table of rep78 by foreign to look at the repair histories of the foreign and domestic cars.