
5 leçons essentielles retenues au DataHarvest 2016. 5 leçons essentielles retenues au DataHarvest 2016 Au rendez-vous européen du datajournalisme, qui avait lieu à Malines (Belgique) du 3 au 5 juin, il ne manquait pas d’exemples pour illustrer la place grandissante de l’analyse des données dans les investigations retentissantes de l’année.

Face à des montagnes de données à exploiter ou à compiler, plusieurs médias se sont rejoints au sein de réseaux internationaux et ont choisi de publier simultanément leurs enquêtes pour maximiser l’impact sur l’audience. Voici les leçons retenues des échanges autour de ces “success stories” : 1) Les datajournalistes doivent s’associer aux journalistes de la rédaction.
The dirty little secret that data journalists aren’t telling you - The Washington Post. Understanding what makes a visualization memorable – Storybench. John Wihbey teaches data journalism in the Media Innovation program at Northeastern University’s School of Journalism.
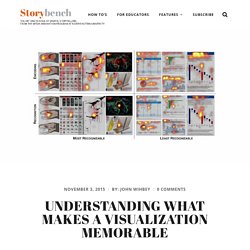
The world of data visualization has long been shaped by canonical ideas from theorists like Edward Tufte. His book The Visual Display of Quantitative Information is a must-read for information designers, which include newsroom graphics editors. Mobile first, desktop later: Creating interactives for the small screen. Every data journalist wants to get their visualizations just right, regardless of how they will be viewed.

Yet, many shy away from adopting mobile-centric approaches. “I’ve heard some people in our craft say that desktop is the best experience,” claimed Aaron Williams at the 2015 Mozilla Festival. “In my opinion, that ignores a huge chunk of the world, particularly people of lower income who might only have phones.” If Williams is right, it is important that newsrooms adopt a mobile-responsive approach to their data. But many struggle to find the right way to go about this.
Comment la dataviz aide à comprendre la crise du logement. Défi : saisir l’ampleur de la crise du logement au Royaume-Uni en un coup d’œil.

Vous pouvez toujours partager des tableurs remplis de chiffres compliqués, mais le résultat risque d’être décevant et surtout barbant. Pour rendre ces statistiques économiques et sociales captivantes, les « dataviz » (visualisation de données) leur ont donné une nouvelle allure. En variant les couleurs, les tailles, de façon automatique ou à la main, les journalistes et les graphistes ont multiplié les tentatives pour transformer l’austérité des données en visuels compréhensibles d’instinct. Les chiffres du logement en pleine rue Un locataire londonien est allé encore plus loin. Évolution du nombre d’expulsions ordonnées par la justice au Royaume-Uni, en 2010, 2013 et 2015. Wedodata, l'agence qui raconte les données - MediaType. Série : Peu nombreuses et souvent petites, les agences web spécialisées dans l'info sont rares et discrètes.
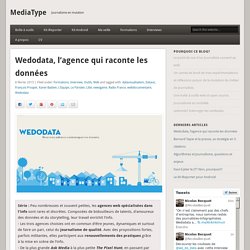
Composées de bidouilleurs de talents, d'amoureux des données et du storytelling, leur travail enrichit l'info. - Les trois agences choisies ont en commun d’être jeunes, dynamiques et surtout de faire un pari, celui du journalisme de qualité. What is data journalism? In the summer of 1967 rioting hit Detroit.

It was a major news story: 43 people died and well over 1,000 were injured, with thousands more arrested. 5 ways hyperlocal sites can do more with data. Credit: Image by Arbron on Flickr.
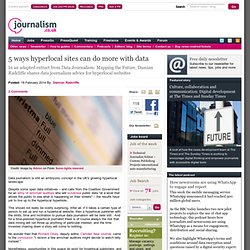
Some rights reserved Data journalism is still an embryonic concept in the UK's growing hyperlocal landscape. Despite some open data initiatives – and calls from the Coalition Government for an army of armchair auditors who will scrutinise public data "at a level that allows the public to see what is happening on their streets" – the results have yet to live up to the hyperlocal hyperbole. This should not really be overly surprising. After all, if it takes a certain type of person to set up and run a hyperlocal website, then a hyperlocal publisher with the skills, time and inclination to pursue data journalism will be rarer still. Oakland Police Beat applies data-driven investigative journalism in California. Share on Tumblr One of the explicit connections I’ve made over the years lies between data-driven investigative journalism and government or corporate accountability.
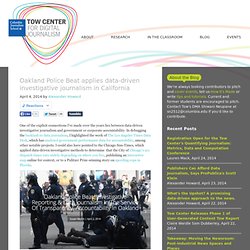
In debugging the backlash to data journalism, I highlighted the work of The Los Angeles Times Data Desk, which has analyzed government performance data for accountability, among other notable projects. I could also have pointed to the Chicago Sun-Times, which applied data-driven investigative methods to determine that the City of Chicago’s 911 dispatch times vary widely depending on where you live, publishing an interactive map online for context, or to a Pulitzer Prize-winning story on speeding cops in Florida. This week, there’s a new experiment in applying data journalism to local government accountability in Oakland, California, where the Oakland Police Beat has gone online. A Baltimore, affluence record pour le « journalisme assisté par ordinateur »
Contrairement à d'autres, nous ne saurions tirer une « grande tendance » de cette conférence.
La 25ème édition de la conférence NICAR s'est tenue à Baltimore du 27 février au 2 mars. Si les algorithmes, les capteurs ou encore la visualisation interactive ont été au cœur des discussions, la seule vraie tendance est peut-être la conférence en elle-même : avec plus de 1000 participants, l'affluence est record. La conférence NICAR réunit des « computer assisted reporters », journalistes assistés par ordinateur, depuis maintenant 25 ans. Avec l'importance croissante qu'ont prises les nouvelles technologies dans nos vies, l'attrait pour cette discipline grandit. Mais l'utilisation de la technologie au service du journalisme n'est pas nouvelle. Recalculating the newsroom: The rise of the journo-coder? Credit: Image by Arbron on Flickr.
Some rights reserved This is an edited version of a chapter fromData Journalism: Mapping the Future, being launched tomorrow by Abramis academic publishing, republished with kind permission. Data journalism: Mapping the future (RRP £15.95) is available at a reduced rate of £12 for Journalism.co.uk readers. Contact richard@abramis.co.uk for further information. 5 questions à 6 datajournalistes. Ils sont datajournalistes et travaillent pour le le site du Guardian, Owni, Lemonde.fr, AskMédia ou J++. Leur point commun : ils sont jeunes et ils ont un goût immodéré pour les données qu’ils aiment manipuler et décortiquer.
Ces ventriloques de la data font parler chiffres et statistiques dans leurs articles, leurs applications ou leurs visualisations. Cinq mêmes questions leur ont été posées pour en savoir un peu plus sur le datajournalisme, ce buzzword qui résonne dans toutes les rédactions. Formation Courrier Picard. Why Is Data Journalism Important? How to Teach a Journalist Programming. Earlier this year I set out to tackle a problem that was bothering me: journalists who had started to learn programming were giving up. They were hitting a wall. In trying to learn the more advanced programming techniques - particularly those involved in scraping - they seemed to fall into one of two camps: People who learned programming, but were taking far too long to apply it, and so losing momentum - the generalists.
People who learned how to write one scraper, but could not extend it to others, and so becoming frustrated - the specialists. In setting out to figure out what was going wrong, I set myself a task which I have found helpful in taking a fresh perspective on an issue: I started writing a book chapter. Journalists - become data literate in three steps. Journalists - become data literate in three steps Details Last Updated on Sunday, 24 June 2012 09:16 Published on Saturday, 23 June 2012 05:31 Written by Nicolas Kayser-Bril Just as literacy refers to 'the ability to read for knowledge, write coherently and think critically about printed material' data literacy is the ability to consume for knowledge, produce coherently and think critically about data. Data literacy includes statistical literacy but also understanding how to work with large data sets, how they were produced, how to connect various data sets and how to interpret them.
Poynter’s News University offers classes of Math for journalists, in which reporters get help with concepts such as percentage changes and averages. That journalists need help in math topics normally covered before high school shows how far newsrooms are from being data literate. A reporter certainly does not need a degree in statistics to become more efficient when dealing with data. Open data journalism. Le journalisme « hacker » À New York, Chicago, Londres, Helsinki ou Buenos Aires, plusieurs centaines de personnes se rencontrent régulièrement, souvent dans des arrières salles de bars ou des salles de conférences [1].
Ils sont étudiants, journalistes, programmeurs ou chefs de projet web, et ils appellent ces réunions informelles des rencontres « hacks/hackers ». « Hacks » est une façon de dénommer les journalistes tandis que « hackers » désigne des passionnés d’informatique. À travers la présentation d’applications informatiques développées pour des sites d’information, la formation à des langages de programmation ou plus simplement la mise en relation de journalistes et de programmeurs, les animateurs de ce réseau veulent relier le monde de la presse aux mondes informatiques de façon à transformer et même « réinitialiser » le journalisme. Les liens entre la presse et les mondes informatiques se sont incontestablement développés ces dernières années. Pourquoi des codeurs s’intéressent-ils à la presse ?
Data journalist handbook project. Rating: 5.0/5 (1 vote cast) By Federica Cocco. In the age of big data, data journalism has profound importance for society. The promise of data journalism was a strong theme throughout the National Institute for Computer-Assisted Reporting’s (NICAR) 2012 conference. In 2012, making sense of big data through narrative and context, particularly unstructured data, will be a central goal for data scientists around the world, whether they work in newsrooms, Wall Street or Silicon Valley. Notably, that goal will be substantially enabled by a growing set of common tools, whether they’re employed by government technologists opening Chicago, healthcare technologists or newsroom developers. Le journalisme les doigts dans les données. Les Jeux olympiques ? La présidentielle ? DataJournalism : données, interactions, visualisations.
Datablog.owni.fr. Les data en forme. La veille des journalistes de données d'OWNI vous fait cette semaine jouer au Rubik's Cube, classer les gouvernements ou encore faire le marathon de New York. Comble du luxe, vous pourrez même comparer la Bible et le Coran...
Qu’il ait été pour vous un cauchemar ou une fascination, vous avez forcément été confronté à un moment de votre vie à ce casse-tête addictif : le Rubik’s Cube. Cette semaine, nous vous proposons de vous replonger dans ce jeu de logique et d’équilibre, dans une version data aussi osée que prometteuse. Le projet E-cube-Librium, développé par le mystérieux Damon, propose de visualiser la croissance des pays du monde et ses diverses composantes sous la forme d’un Rubik’s cube.
Sur chacune des six faces, Damon a positionné différents indicateurs (certains indicateurs se retrouvent sur plusieurs faces) selon trois piliers principaux : Républicains et religieux Après avoir joué avec les formes, jouons avec les mots.