
Learning Statistics with R. Can we please move beyond just “What’s better; SPSS or R?” I’ve had a “why and how I transitioned from SPSS to R” post in the works for awhile.
I wanted to highlight how R can be more useful for transparent data work-flows. Then, a few days ago, yet another “what’s better SPSS or R?” Kind of debate came up on twitter. It’s similar to the p-value wars, or the continuing frequentist vs bayesian battles that manage to simultaneously frustrate and intrigue me. There might be some utility in the discussion, but often it’s just butting heads and missing other important issues. This post is a ham-handed, Coors fueled attempt at mashing together why debating what is the better software is (mostly) pointless and why there are more important issues to address.
There’s something that happens pretty early on in learning a programming language like R, especially when transitioning from the pointy-clicky, draggy-droppy -ness of SPSS. Then, something happens. R for Data Science. Introduction to R. A Tutorial on Data Structures in R. With this tutorial on data structures in R we want to give you, in a newbie friendly way, a better insight into the different data structures that R offers: vectors, list, and matrices (or arrays with higher dimension).
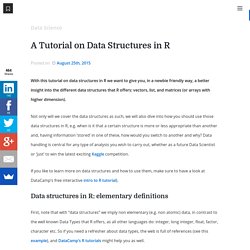
Not only will we cover the data structures as such, we will also dive into how you should use those data structures in R, e.g. when is it that a certain structure is more or less appropriate than another and, having information ‘stored’ in one of these, how would you switch to another and why? Data handling is central for any type of analysis you wish to carry out, whether as a future Data Scientist or ‘just’ to win the latest exciting Kaggle competition. Regression Models for Data… by Brian Caffo. Beginning_R.pdf. Kickstarting R. El arte de programar en R Un leguaje para la estadística. Programming tools: Adventures with R. Illustration by The Project Twins For years, geneticist Helene Royo used commercial software to analyse her work.
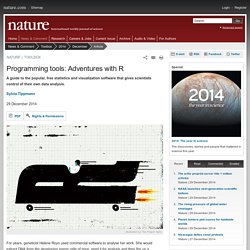
She would extract DNA from the developing sperm cells of mice, send it for analysis and then fire up a package called GeneSpring to study the results. “As a scientist, I wanted to understand everything I was doing,” she says. “But this kind of analysis didn’t allow that: I just pressed buttons and got answers.” And as Royo’s studies comparing genetic activity on different chromosomes became more involved, she realized that the commercial tool could not keep up with her data-processing demands. With the results of her first genomic sequencing experiments in hand at the start of a new postdoc, Royo had a choice: pass the sequences over to the experts or learn to analyse the data herself. Besides being free, R is popular partly because it presents different faces to different users. That, indeed, is what R’s developers intended when they designed it in the 1990s.
I’m published! “R Succinctly” available now as a free download! Swirl - Home. The Analysis Factor — Statistical Consulting, Resources, and Statistics Workshops for Researchers in Psychology, Sociology, and other Social and Biological Sciences. One Page R: A Survival Guide to Data Science with R. Sé R o no sé R - Home. Beaker Notebook - The data scientist's laboratory. Tutorials for Non-Programmers and Beginners - Online Course. R for cats · and cat lovers. Spreadsheet Addiction. Some people will think that the “addiction” in the title is over the top, or at least used metaphorically.
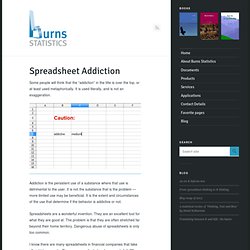
It is used literally, and is not an exaggeration. Addiction is the persistent use of a substance where that use is detrimental to the user. It is not the substance that is the problem — more limited use may be beneficial. It is the extent and circumstances of the use that determine if the behavior is addictive or not. Spreadsheets are a wonderful invention. I know there are many spreadsheets in financial companies that take all night to compute.
A 2012 example of spreadsheet addiction. The technology acceptance model holds that there are two main factors that determine the uptake of a technology: the perceived usefulness and the perceived ease-of-use. The perception of the ease-of-use of spreadsheets is to some extent an illusion. The difficulty of using alternatives to spreadsheets is overestimated by many people. The hard way looks easy, the easy way looks hard. An R "meta" book. By Joseph Rickert I am a book person.
I collect books on all sorts of subjects that interest me and consequently I have a fairly extensive collection of R books, many of which I find to be of great value. Nevertheless, when I am asked to recommend an R book to someone new to R I am usually flummoxed. R is growing at a fantastic rate, and people coming to R for the first time span I wide range of sophistication. And besides, owning a book is kind of personal. Recently, however, while crawling around CRAN, it occurred to me that there is a tremendous amount of high quality material on a wide range of topics in the Contributed Documentation page that would make a perfect introduction to all sorts of people coming to R. The content column lists the topics that I think ought to be included in a good introductory probability and statistics textbook. Finally, I don’t mean to imply that the documents in my table are the best assembled in the Contributed Documentation page.
StatsTeachR. aRrgh: a newcomer's (angry) guide to R. Tim Smith <arrgh@tim-smith.us>, @biotimylated with Kevin Ushey <kevinushey@gmail.com>, @kevin_ushey R is a shockingly dreadful language for an exceptionally useful data analysis environment.

The more you learn about the R language, the worse it will feel. The development environment suffers from literally decades of accretion of stupid hacks from a community containing, to a first-order approximation, zero software engineers. Vectorization in R: Why? Here are my notes from a recent talk I gave on vectorization at a Davis R Users’ Group meeting.
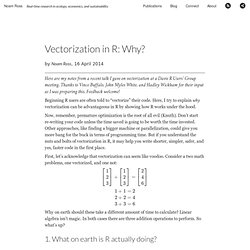
Thanks to Vince Buffalo, John Myles White, and Hadley Wickham for their input as I was preparing this. Feedback welcome! Beginning R users are often told to “vectorize” their code. Here, I try to explain why vectorization can be advantageous in R by showing how R works under the hood. Now, remember, premature optimization is the root of all evil (Knuth). First, let’s acknowledge that vectorization can seem like voodoo. Rserve - Binary R server - RForge.net. JRI - Java/R Interface - RForge.net.
Practical Code Solutions: Rcaller 2.0 - Calling R from Java. I have received too many e-mails since i had first submitted the early versions of the RCaller.
Some users found it usable so i was planning to develop a newer and enhanced version of this library. Now, i think, it is ready for testing. The 2.0.0 version of the RCaller is downloadable from with both compiled jar file and the source file with the directory structure of NetBeans 7. The use of RCaller is changed after version 1.0 but it is still easy to implement, it does not need extra libraries, it is platform independent and compatible with the recent R versions. Some new features in version 2.0.0 are: 1) Support for plots 2) Easier code generation 3) Enhanced interaction with R Before anything, install the R package "Runiversal" by typing install.packages ( "Runiversal" )
Java-R integration. One Page R: A Survival Guide to Data Science with R.