
Diagramme de Voronoï. Un article de Wikipédia, l'encyclopédie libre.
Histoire[modifier | modifier le code] On peut faire remonter l’usage informel des diagrammes de Voronoï jusqu'à Descartes en 1644 dans Principia philosophiae comme illustration de phénomène astronomique [1]. Dirichlet a utilisé des diagrammes de Voronoï en dimension 2 ou 3 dans son étude des formes quadratiques en 1850 (Dirichlet 1850). En 1854, le médecin britannique John Snow a utilisé le diagramme de Voronoï des pompes pour montrer que la majorité des personnes mortes dans l’épidémie de choléra de Soho se trouvaient dans la cellule de la pompe à eau de Broad Street, donc qu'ils vivaient plus près de cette pompe que de n’importe quelle autre pompe[2].
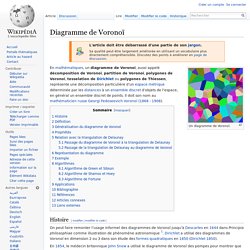
Il a ainsi démontré que le foyer de l'infection était cette pompe. Les diagrammes de Voronoï portent le nom du mathématicien russe Georgy Fedoseevich Voronoï (ou Voronoy) qui a défini et étudié le cas général en dimension n en 1908. Définition[modifier | modifier le code] . Fortune's algorithm - Wikipedia, the free encyclopedia - Mozilla. Fortune's algorithm animation Fortune's algorithm is a sweep line algorithm for generating a Voronoi diagram from a set of points in a plane using O(n log n) time and O(n) space.[1][2] It was originally published by Steven Fortune in 1986 in his paper "A sweepline algorithm for Voronoi diagrams.
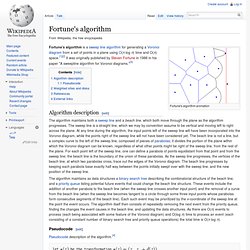
"[3] Algorithm description[edit] The algorithm maintains both a sweep line and a beach line, which both move through the plane as the algorithm progresses. The algorithm maintains as data structures a binary search tree describing the combinatorial structure of the beach line, and a priority queue listing potential future events that could change the beach line structure. Pseudocode[edit] Pseudocode description of the algorithm.[4] let be the transformation , where is the Euclidean distance between and the nearest site let be the "beach line" let be the region covered by site . let be the boundary ray between sites.
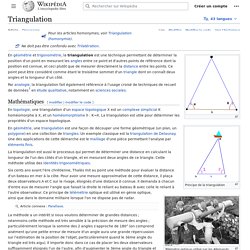
Fortunes-algorithm.gif - Wikipedia, the free encyclopedia. Triangulation de Delaunay. Un article de Wikipédia, l'encyclopédie libre. Pour les articles homonymes, voir Delaunay. Triangulation. Un article de Wikipédia, l'encyclopédie libre.
Fichier:Delaunay geometry.png - Wikipédia. Un exemple de creation d'un diagramme de Voronoi. Un exemple de creation d'un diagramme de Voronoi. 1.6.4 Voronoi Diagrams. 1.6.4 Voronoi Diagrams Input Description: A set S of points p_1,...,p_n.
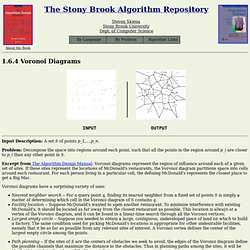
Problem: Decompose the space into regions around each point, such that all the points in the region around p_i are closer to p_i than any other point in S. Excerpt from The Algorithm Design Manual: Voronoi diagrams represent the region of influence around each of a given set of sites. If these sites represent the locations of McDonald's restaurants, the Voronoi diagram partitions space into cells around each restaurant.
Voronoi diagrams have a surprising variety of uses: Nearest neighbor search -- For a query point q, finding its nearest neighbor from a fixed set of points S is simply a matter of determining which cell in the Voronoi diagram of S contains q. Recommended Books Related Problems www.algorist.com. Fortune's 2D Voronoi diagram code. About the Book The Stony Brook Algorithm Repository Steven Skiena Stony Brook University Dept. of Computer Science Fortune's 2D Voronoi diagram code This is a fairly widely-used 2D code for Voronoi diagrams and Delauney triangulations, written in C by Steve Fortune of Bell Laboratories.
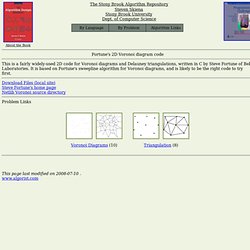
It is based on Fortune's sweepline algorithm for Voronoi diagrams, and is likely to be the right code to try first. Download Files (local site)Steve Fortune's home pageNetlib Voronoi source directoryProblem Links www.algorist.com. Main Page - VoroWiki. Three-dimensional Voronoi Diagram - VoroWiki. From VoroWiki While the generation of models of complex surfaces is sufficient for many applications, true 3D (volumetric) application require a true 3D data structure.
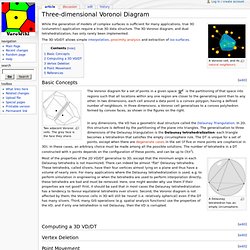
The 3D Voronoi diagram, and dual tetrahedralization, has only rarely been implemented. The 3D VD/DT allows simple interpolation, proximity analysis and extraction of iso-surfaces. Basic Concepts Two adjacent Voronoi cells. The Voronoi diagram for a set of points in a given space is the partitioning of that space into regions such that all locations within any one region are closer to the generating point than to any other. In any dimensions, the VD has a geometric dual structure called the Delaunay Triangulation.
A Delaunay tetrahedron has an empty circumsphere. Most of the properties of the 2D VD/DT generalise to 3D, except that the minimum angle in each Delaunay tetrahedra is not maximized. Image:3dvd.jpg - VoroWiki. Construction of a VD/DT - VoroWiki. From VoroWiki Dual structure Since the Voronoi diagram (VD) and the Delaunay triangulation (DT) are dual structures, the knowledge of one implies the knowledge of the other one; in other words, if one has only one structure, he can always extract the other one.
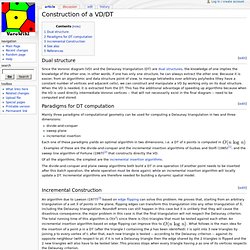
Because it is easier, from an algorithmic and data structure point of view, to manage tetrahedra over arbitrary polyhedra (they have a constant number of vertices and adjacent cells), we can construct and manipulate a VD by working only on its dual structure. When the VD is needed, it is extracted from the DT. This has the additional advantage of speeding up algorithms because when the VD is used directly intermediate Voronoi vertices -- that will not necessarily exist in the final diagram -- need to be computed and stored. Paradigms for DT computation Mainly three paradigms of computational geometry can be used for computing a Delaunay triangulation in two and three dimensions: divide-and-conquer sweep plane incremental insertion . Image:Insertion steps.png - VoroWiki.