
HR Org Chart Example - Raphael JS. RaphaelJS shapes Drag&Drop demo. Dasha Salo's Blog. jSVG - Simple JavaScript SVG Asset Management (uses jQuery) gRaphaël—Charting JavaScript Library. RoomandBoard/vectron @ GitHub. I Run My Website Index. Raphael.js + Backbone.js + Traer.js. Raphael.js is a cool vector graphic drawing library for javascript.
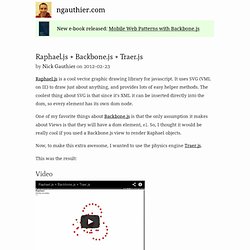
It uses SVG (VML on IE) to draw just about anything, and provides lots of easy helper methods. The coolest thing about SVG is that since it's XML it can be inserted directly into the dom, so every element has its own dom node. One of my favorite things about Backbone.js is that the only assumption it makes about Views is that they will have a dom element, el. So, I thought it would be really cool if you used a Backbone.js view to render Raphael objects. Now, to make this extra awesome, I wanted to use the physics engine Traer.js. This was the result: Video Demo Visit demo page There are four levels here: Particle: managed by TraerModel: Backbone model wrapping the particleElement: svg element managed by RaphaelView: Backbone view wrapping the model and the element Step 1.
This first thing I had to do was make two small changes to Traer: Now, particles will fire a change event after a physics tick. Step 2. Step 2. Notes. SVG To RaphaelJS Converter - Ready.Set.Raphael. Beta 2. Using RaphaelJS To Create A Map. The brief was actually quite simple.
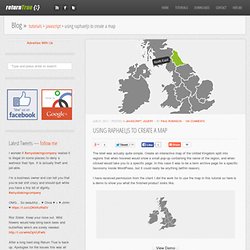
Create an interactive map of the United Kingdom split into regions that when hovered would show a small pop-up containing the name of the region, and when clicked would take you to a specific page. In this case it was to be a term archive page for a specific taxonomy inside WordPress, but it could really be anything (within reason). I have received permission from the client I did the work for to use the map in this tutorial so here is a demo to show you what the finished product looks like. Happy? Good. Prerequisites You need to grab yourself an image of the map, item, or whatever it is you want to create with RaphaelJS. This can be exceptionally confusing to some so here is a visual example of how vector graphics, like SVG, differ from raster graphics, like JPG or Bitmap.
As you can see, when you scale up a raster image you start to lose detail & the image starts to degrade quite badly. Raphael JS Quickstart. Raphaël—JavaScript Library. 1.3.8 demo - jQuery. Window 1 I am plumbed with a Bezier connector to Window 2 and a label, with Blank endpoints.
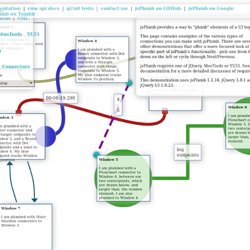
Window 2 I am plumbed with a Bezier connector to Window 1, and a Bezier connector with Rectangle endpoints to Window 3 Window 3 I am plumbed with a Bezier connector and Rectangle endpoints to Window 2, and a Bezier connector with Dot endpoints and a label to Window 4. Window 4 I am plumbed with a Bezier connector with Dot endpoints to Window 3, and with a Straight connector with Image endpoints to Window 5.
Window 5 I am plumbed with a Flowchart connector to Window 6, between our two centerpoints, which are drawn below, and larger than, the window element; I am also plumbed to Window 4. Window 6 I am plumbed with a Flowchart connector to Window 5, between our two centerpoints, which are drawn below, and larger than, the window element. Window 7 I am plumbed with State Machine connectors to Window 3. Connection One. Raphaël · Graffle.