
USING%20MIXED%20MESH%20IN%20SOLIDWORKS%20SIMULATION.pdf. Sheet%20Metal%20Bodies.pdf. Problem loading page. SolidWorks Professor - Dynamic Analysis for Vibration Testing in SolidWorks Simulation Premium. SolidWorks Simulation - Natural Frequencies, Mode Shapes & Vibration Tutorial. Resonating to the Harlem Shake - SolidWorks Simulation. Back in early February, a new internet sensation swept the world via YouTube called the “Harlem Shake”.
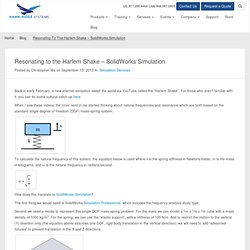
For those who aren’t familiar with it, you can do some cultural catch-up here. When I saw these videos, the inner nerd in me started thinking about natural frequencies and resonance which are both based on the standard single degree of freedom (DOF) mass-spring system: To calculate the natural frequency of this system, the equation below is used where k is the spring stiffness in Newtons/meter, m is the mass in kilograms, and ω is the natural frequency in radians/second. How does this translate to SolidWorks Simulation? The first thing we would need is SolidWorks Simulation Professional, which includes the frequency analysis study type.
Frequency Studies in SolidWorks Simulation Professional by Brian Zias. Frequency Studies in SolidWorks Simulation Professional by Brian Zias Intro Every product is subject to real-world conditions that ultimately cause failure in one way or another.

SolidWorks Simulation is a tool to computationally quantify the performance of our assemblies and components inside SolidWorks. : The Importance of Frequency Analysis. Have you heard the buzz about running a frequency analysis on your assemblies?

Actually… if you've heard a buzz at all, frequency was the reason. Sounds are transmitted by an object that vibrates and. Theory of Vibration. PRSG027: How To Analyze Noise & Vibration From Rotating Machinery (Complete) Fourier Transforms. Introduction "Lies, Damn Lies, and Statistics.
" Few people appreciate statistics. But at least they seem OK with this and don't go off starting religious wars over the subject. Alas, such is not the case with Fourier transforms. Fourier Series. Webinar 4 Random Vibration. SolidWorks Simulation- PSD Units in Random Vibration. PCB Crosstalk Fundamentals What It Is and How You Can Prevent It. Lccalc.pdf.
Scaa082.pdf. 400.pdf. Signal integrity. Signal integrity or SI is a set of measures of the quality of an electrical signal.
In digital electronics, a stream of binary values is represented by a voltage (or current) waveform. However, digital signals are fundamentally analog in nature, and all signals are subject to effects such as noise, distortion, and loss. Over short distances and at low bit rates, a simple conductor can transmit this with sufficient fidelity. At high bit rates and over longer distances or through various mediums, various effects can degrade the electrical signal to the point where errors occur and the system or device fails.
Understanding Crosstalk and How To Eliminate It - Behind The Mixer. Category 5 / 5E & Cat 6 Cabling Tutorial and FAQ's. At LANshack.com you will find the highest quality Datacom products on the market for the most critical networks.

LANshack.com manufactures custom fiber optic and copper cable assemblies to make your installation as seamless and robust as possible. You will discover a huge selection of products creating a one-stop-shopping experience for your cable installation. LANshack's full spectrum of QuickTrex Custom Fiber Optic Patch Cables, Mode Conditioning Cables, and Pre-Terminated Fiber Assemblies are made in the USA by highly trained technicians at the time of your order, are individually tested, and come with test results! PIER/pier104/10.10041003.pdf. Average and effective values. Voltage, Current, Power & Energy : Definitions. Last Modification: February 17, 2013 Connecting a measurement instrument in the right way only is one thing.
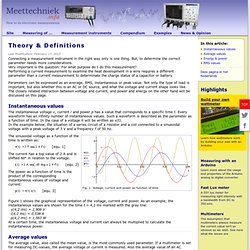
But, to determine the correct parameter needs more considerations. Very important is the question: For what purpose do I do this measurement? Performing a current measurement to examine the heat development in a wire requires a different parameter than a current measurement to determinate the charge status of a capacitor or battery. Parameters can be expressed as an average, RMS, instantaneous or peak value. SolidWorks Premium is the right choice for Design Engineers that need everything. How is Machine Vibration Described? By Commtest Instruments To analyze the condition of a machine you first need to accurately describe the behavior or symptoms of the machine.

How can vibration symptoms be described accurately? How do vibration analysts describe the condition of a machine? Vibration Amplitude Measurement. Vibration Amplitude Measurement The following definitions apply to the measurement of mechanical vibration amplitude.
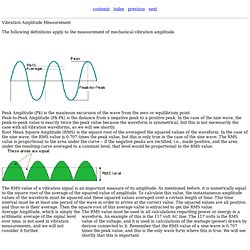
Peak Amplitude (Pk) is the maximum excursion of the wave from the zero or equilibrium point. Fundamentals_of_Vibration_Measurement_and_Analysis_Explained.pdf. Microsoft PowerPoint - Beginning Vibration Analysis - Red Folder - 01-Beginning Vibration Analysis.pdf. 1202vanb.pdf. Microsoft PowerPoint - 315_randomvibration - 315_randomvibration.pdf. What is power spectral density. Power spectral density (PSD), which describes how the power of a signal or time series is distributed with frequency.
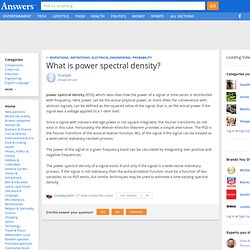
Here power can be the actual physical power, or more often, for convenience with abstract signals, can be defined as the squared value of the signal, that is, as the actual power if the signal was a voltage applied to a 1-ohm load. Since a signal with nonzero average power is not square integrable, the Fourier transforms do not exist in this case. Fortunately, the Wiener-Khinchin theorem provides a simple alternative. The PSD is the Fourier transform of the autocorrelation function, R(τ), of the signal if the signal can be treated as a wide-sense stationary random process. The power of the signal in a given frequency band can be calculated by integrating over positive and negative frequencies. Power spectra. "Power Spectra" answers the question "which frequencies contain the signal´s power?
" The answer is in the form of a distribution of power values as a function of frequency, where "power" is considered to be the average of the signal². In the frequency domain, this is the square of FFT´s magnitude. ES203 Lec 9-2: RMS value, Power Calculations. The Concept of RMS.