
Twittergids. Myers-Briggs Type Indicator. De Myers-Briggs Type Indicator (MBTI) is een systematiek om de verschillen in persoonlijkheid van mensen te classificeren.

Insert smileys and other emoticons - Support. If you've used an instant messenger or chat service, you've seen the ubiquitous smiley and frowning faces used to represent happy and sad.
These symbols are called emoticons, a combination of the words "emotion" and "icon," and you can insert them to add a personal touch to most Office documents. Note In a purely unscientific poll of the Office Online team, we couldn't agree on what the third symbol meant. Different people thought that it was a sign either of indifference, frustration, or grumpiness. Email Marketing and Email List Manager. Wat is er niet duidelijk aan: “Wij zijn de 99%”? — Sanne Roemen. Massive Influencers: Social Media 3.0.
Massive Influencers: Social Media 3.0 Over the past several months there has been a rise in the demand for monitoring content, and startups have responded by creating browser-based user-interfaces that collate data from various sites – and it is up for the user to pick and choose, to be the “curator” of their online space [i.e Pearltrees, Paper.li].

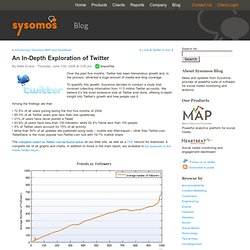
The change of focus from content production to organization is no coincidence: social content has been toeing the line between value and spam for quite some time. By liberating content selection / visibility from the hands of monopolized search engines, more ideas will be heard: not just “any” ideas, but the right ideas. According to Forrester Research, “having masses of random followers is a problem…only about 16% of the total American online audience are considered Massive Influencers.” This realization harkens back to meeting a customer’s wants. But what makes content "relevant" to your customers? In-Depth Exploration of Twitter. By Mark Evans - Thursday, June 11th, 2009 at 3:00 pm ShareThis Over the past five months, Twitter has seen tremendous growth and, in the process, attracted a huge amount of media and blog coverage.

To quantify this growth, Sysomos decided to conduct a study that involved collecting information from 11.5 million Twitter accounts. We believe it’s the most extensive look at Twitter ever done, offering in-depth insight into Twitter’s growth and how people use it. Among the findings are that: Twitter low retention. Twitter KPIs. [To keep up with our latest research and updates, follow us on Twitter @RJMetrics] Since my guest post on TechCrunch last fall, I’ve received frequent requests to update and expand upon my Twitter data analysis.

As the Twitter API continues to improve, our ability to profile the company from the outside-looking-in becomes even stronger. I recently conducted an updated round of analysis and will be posting my findings in a series of posts here at The Metric System in the coming weeks. Updating this analysis in RJMetrics was just a matter of a few clicks, and we could easily highlight the most interesting tidbits of new information. If you’d like that level of control of your own business’s data, you should try out our demo to learn more. Today, I’m starting with an update of the basics: users and engagement.
Results Summary. The full report. Turn Social Intelligence Into Smart Crisis Prevention Find out how to prevent a social media crisis and protect your brand's reputation with your most powerful PR tool: social intelligence.

How to Get Social Media Influencers Talking About Your Brand 6 tips to help you identify and build strong relationships with social influencers. User retention. Do you have happy, smiling users?

I've previously written a lot about metrics and user acquisition - just look at the left bar of this blog - but have not written much about metrics and user retention. By retention, I mean the process in which you convert new users who don't care about your site into recurring users that are loyal and continually drive pageviews. In general, I would say that more people care about this than pure user acquisition, which is great, but they are often using aggregate numbers to measure this retention. By aggregate data, I mean looking at an overall Google Analytics number, or looking at an Alexa rank, or some other rolled-up metric which doesn't differentiate between new users that are discovering your site for the first time versus loyal users that are returning to your site. In fact, in general I think of websites as "leaky buckets" where users are constantly getting poured into the top, and the site is constantly leaking users.
Virality limited by retention. Excel spreadsheet downloadFor those of you who are interested in the gory details, please download the following spreadsheet here: Viral and Retention Excel Model (Click to download) Math warning!

This blog post will be a little more technical than usual, so I apologize to those of you who are bored by this. Anyway, let's get started. See this image before? That's what happens when you "jump the shark" and your app goes from successful to completely not successful. Modeling user acquisitionFirst off, let's look at some ways to model user acquisition. Invite conversion rate % = 10% Average invites per person = 8.00 Initial user base = 10,000 Carrying capacity = 100,000.