
The Many Faces of Global Migration. Description: The Many Faces of Global Migration report is an introduction to what Gallup has unearthed by asking migrants and potential migrants worldwide about their lives.
The data presented in this report are based on Gallup’s ongoing World Poll surveys in more than 150 countries, territories and regions and more than 750,000 interviews since 2005. As such, these findings provide an unprecedented look at the different push-and-pull factors that influence migration, the experiences of those who desire to migrate to other countries permanently or temporarily for work, those who are planning to go, those who are preparing to go, those who have already left, and those who have returned home – and what this means for governments, intergovernmental and non-governmental organizations, and other stakeholders.
Table of Contents. Travel Medicine map (Travax) Disaster Alert Network - ubAlert. Travel Medicine map (Travax) HealthMap - DENGUE. Marker Color Marker color reflects the noteworthiness of events at a particular location during a given time window.
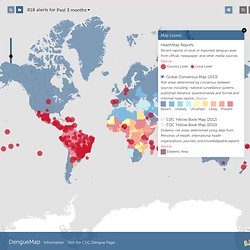
An event's degree of noteworthiness is based on the significance rating of the alert provided by HealthMap users. In the absence of user ratings, the system assigns a composite score based on the disease importance and the news volume associated with the alert. Global Incident Map - Outbreaks. Lonely Planet Travel Information for any Holiday Destination.
Shoreland Travax. Current Travel Warnings. FluTracker - H1N1 Swine Flu and Influenza Outbreak Tracking from. Influenza Net. Geographic Information Systems. Travel Health Service Destinations. NaTHNaC Health Professionals. 9 April 2014 World Cup Webchat Going to Brazil for the World Cup, or are you a health professional advising travellers?

NaTHNaC will be taking questions live on Monday, 14th April from 12.30pm to 1.30pm in a webchat hosted by The Foreign & Commonwealth Office (FCO). The World Cup Q&A session offers the opportunity to ask health-related questions from vaccination requirements to advice on malaria and what to do in case of an emergency. The event hosted by @FCOtravel will be using #beontheball to enable you to join in the conversation. 4 April 2014 World Health Day - 7 April 2014 On World Health Day 2014, WHO is calling for a renewed focus on vector control and better provision of safe water, sanitation and hygiene which could help prevent the spread of disease. 31 March 2014 WHO Drug Alert: Counterfeit antimalarial medicines in Africa On 25 March 2014, WHO issued a drug alert: Falsified antimalarial medicines in west and central Africa. 26 March 2014 28 February 2014.
Home - Fit For Travel. Travel Medicine (Travax,HPS) Background Notes. Destinations - Travelers' Health - CDC. AIDSMap. Health Map: Real-Time Sickness and Disease Reports at GermTrax. A Graph of the Laziest Countries in the World (Hooray! We're Not #1) - Derek Thompson. Congratulations, Maltese women: You are the world's most physically inactive demographic!
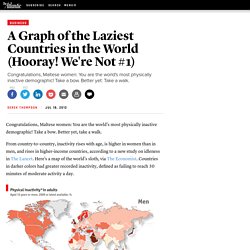
Take a bow. Better yet, take a walk. From country-to-country, inactivity rises with age, is higher in women than in men, and rises in higher-income countries, according to a new study on idleness in The Lancet. World Bank Publications. The World Bank eAtlas mapping tool, developed in cooperation with Harper Collins UK, allows users to easily and quickly transform data into customized visual comparisons across time, countries, and regions.
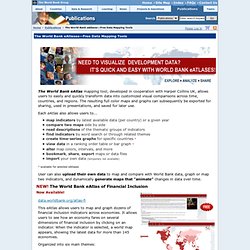
The resulting full color maps and graphs can subsequently be exported for sharing, used in presentations, and saved for later use. Each eAtlas also allows users to... map indicators by latest available data (per country) or a given year compare two maps side by side read descriptions of the thematic groups of indicators find indicators by word search or through related themes create time-series graphs for specific countries * view data in a ranking order table or bar graph * alter map colors, intervals, and more bookmark, share, export maps or data files import your own data (temporary not available) * available for selected eAtlases.
The WHO e-atlas of disaster risk for the European Region. Lives on the Line. New malaria maps to guide battle against the disease. The revised global yellow fever risk map and recommendations for vaccination, 2010: consensus of the Informal WHO Working Group on Geographic Risk for Yellow Fever : The Lancet Infectious Diseases. Introduction Yellow fever is an acute infectious disease caused by the yellow fever virus, a flavivirus transmitted in tropical or subtropical areas, mainly through the bite of infected Aedes spp mosquitoes in Africa or Haemagogus spp mosquitoes in South America. On both continents, both jungle (sylvatic) and urban transmission cycles exist. In the jungle cycle, the virus is transmitted between non-human primates and various mosquito species in the forest canopy.
X-Dengue.com. New model of disease contagion ranks U.S. airports in terms of their spreading influence. World map shows flight routes from the 40 largest U.S. airports.Image: Christos Nicolaides, Juanes Research Group Public health crises of the past decade — such as the 2003 SARS outbreak, which spread to 37 countries and caused about 1,000 deaths, and the 2009 H1N1 flu pandemic that killed about 300,000 people worldwide — have heightened awareness that new viruses or bacteria could spread quickly across the globe, aided by air travel.
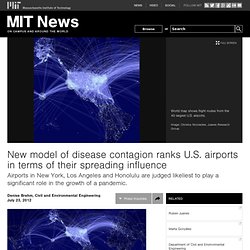
While epidemiologists and scientists who study complex network systems — such as contagion patterns and information spread in social networks — are working to create mathematical models that describe the worldwide spread of disease, to date these models have focused on the final stages of epidemics, examining the locations that ultimately develop the highest infection rates. A Metric of Influential Spreading during Contagion Dynamics through the Air Transportation Network. Results Stochastic Model of Agent Mobility Air transportation data. We develop a stochastic model of human mobility through a US-centric air transportation network. We use air-travel data provided by the Federal Aviation Administration (www.faa.gov) that includes all flights from all domestic and international airlines with at least one origin or destination inside the US (including Alaska and Hawaii), for the period between January 2007 and July 2010. Open Source, Geo & Health Workshop (#gecohealth) Invalid quantity.
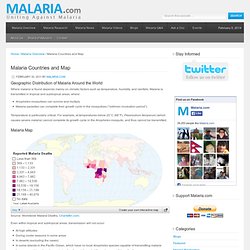
Please enter a quantity of 1 or more. The quantity you chose exceeds the quantity available. Please enter your name. Please enter an email address. Please enter a valid email address. Please enter your message or comments. Please enter the code as shown on the image. Please select the date you would like to attend. Please enter a valid email address in the To: field. Please enter a subject for your message. Please enter a message. Global Malaria (dark) Malaria - Travelers - CDC Malaria Map Application. Skip directly to search Skip directly to A to Z list Skip directly to navigation Skip directly to site content Skip directly to page options.
Malaria Countries and Map. Geographic Distribution of Malaria Around the World Where malaria is found depends mainly on climatic factors such as temperature, humidity, and rainfalls.
Global Health Observatory. A Metric of Influential Spreading during Contagion Dynamics through the Air Transportation Network. Malaria Atlas Project. Malaria Elimination Group.