
Artikis-bg.pdf. Big-data-xeon-e5-trustway-case-study.pdf. BSL8-0044-0023-httpwww_bg_utp_edu_plartarchives20of20transport20system20telematics2008-20112011-112004. Cell phone tracking system reveals how traffic jams start. Fp02-hull.pdf. Home. How Melbourne Is Fast-Tracking Smart Transit Using Big Data More than ever, we need smart, reliable, and efficient public transit systems.
As people flock to cities -- because more humans are living in metropolitan areas than in rural areas for the first time in history -- energy demands are rising worldwide. The same old approach to planning and maintaining transportation networks just won't work anymore. That's why Melbourne, Australia's Yarra Trams, the largest tram system in the world, turned to big data, the cloud, mobile, and analytics to transform its services. IBM Smarter Cities initiative: Using big data for better traffic flow. City living is making a come back, and with it has come increasing congestion, longer commutes, and bad air quality.
IBM’s Smarter Cities Initiative aims to take the ever growing amount of real-time data—from traditional loop sensors and GPS on buses and trains to weather data, traffic cameras, and even feedback from smart phones—and combine it with computing analytics to predict what the near future of traffic will look like in different parts of the network and make proactive interventions to alleviate the problems. Naveen Lamba, associate partner and Smart Transportation Leader in IBM’s Global Business Services points out that solving transportation issues involves more than just adjusting traffic signal timing.
Lamba notes three pieces: identifying the problem, accurately telling travelers what to expect, and implementing system-wide changes to keep traffic moving. Linear regression. In statistics, linear regression is a linear approach to modeling the relationship between a scalar response (or dependent variable) and one or more explanatory variables (or independent variables).
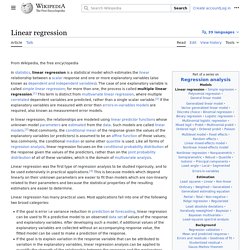
The case of one explanatory variable is called simple linear regression. For more than one explanatory variable, the process is called multiple linear regression.[1] This term is distinct from multivariate linear regression, where multiple correlated dependent variables are predicted, rather than a single scalar variable.[2] In linear regression, the relationships are modeled using linear predictor functions whose unknown model parameters are estimated from the data. Such models are called linear models.[3] Most commonly, the conditional mean of the response given the values of the explanatory variables (or predictors) is assumed to be an affine function of those values; less commonly, the conditional median or some other quantile is used.
Linear regression has many practical uses. Making Location Work for Smart Cities – the Case for Location Standards. The Case for Location Standards The OGC’s chief engineer, George Percivall, believes there are a few relevant trends in “smart cities” and identifies the importance of open location standards to any smart city undertaking.
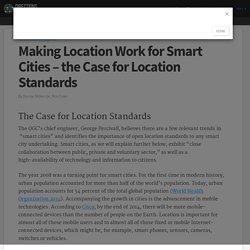
Smart cities, as we will explain further below, exhibit “close collaboration between public, private and voluntary sector,” as well as a high-availability of technology and information to citizens. The year 2008 was a turning point for smart cities. For the first time in modern history, urban population accounted for more than half of the world’s population.
Today, urban population accounts for 54 percent of the total global population (World Health Organization 2014). Another trend that calls for open location standards is the growth of 3D spatial visualization, well represented by the city of Berlin’s implementation using OGC’s CityGML standard. The growth in the Internet of Things (IoT) is part of the smart cities phenomenon. Smart Cities in Action Summary. Metro Vancouver project monitors private cellphones to track traffic jams. Someone else’s cellphone could be helping you avoid a traffic jam.

B.C.’s Ministry of Transportation and Infrastructure, Transport Canada and TransLink, which runs the Vancouver region’s transit system, unveiled an online map on Wednesday that displays real-time, colour-coded traffic information using data collected from cellphone signals. The information on the map is created by collecting anonymous GPS data from cellphone users who are driving on the region’s highways and major roads to determine the general speed of movement along each route.
Roads and highways on the map, which is updated constantly, are coloured red for very slow movement, yellow to signal congestion and green if travel is trouble-free. TransLink and DriveBC, the provincial government’s traffic service, have both posted the map on their websites and are encouraging travellers to use the map for pre-trip planning. But the B.C. MirrorLink. NYC Open Data. POST-PN-472. RDE Home Page. Transportation & Logistics Co. Accelerates Analytical Reporting 5x, Enabling Faster More Informed Decision Making - SAP HANA. Problem: In fast moving industries, making ‘the right’ decision is not good enough.
You have to make the right decision at the right time. A line of action that might have worked yesterday might be ineffective today – or worse, it could be counterproductive. While it might sound a bit cliched, success depends on getting the right information to the right people at the right time. Organizations that can consistently do this reap significant advantage in today’s competitive environment. The challenge can be daunting – especially for big companies. This was the challenge confronting Russian Railways – a company with approximately one million employees responsible for transporting passengers and freight across a network that spanned 11 time zones. Solution: When Russian Railways turned to SAP for help, they found a true partner. Benefits: The results were impressive. Resources: English version: Russian version: Transportation industry best practices and white papers featuring improved origin destination studies, transportation solutions for Point of Interest (POI), sports arenas and more.
Complimentary White Papers, Data and More...

AirSage Nationwide Commute Report U.S. Commuter Data for April 2014 How many people commute to my county and from what counties do they commute? What top 20 counties do people commute from when commuting to my county? The complimentary AirSage Nationwide Commute Report answers all of these questions by providing key insights into commuting patterns.