
Neural Net + TensorFlow. Introducing Cloud Hosted Deep Learning Models. Introducing Cloud Hosted Deep Learning Models At Algorithmia, we believe in democratizing access to state-of-the-art algorithmic intelligence.
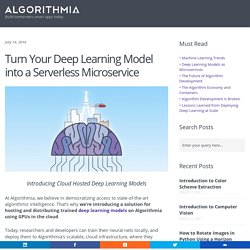
That’s why we’re introducing a solution for hosting and distributing trained deep learning models on Algorithmia using GPUs in the cloud. Rotate Images in Python Using a Horizon Detection Algorithm - Algorithmia. When we look at an image, it’s fairly easy to detect the horizon line.
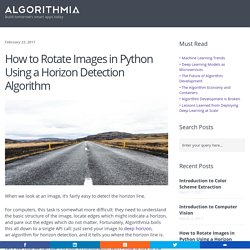
For computers, this task is somewhat more difficult: they need to understand the basic structure of the image, locate edges which might indicate a horizon, and pare out the edges which do not matter. Fortunately, Algorithmia boils this all down to a single API call: just send your image to deep horizon, an algorithm for horizon detection, and it tells you where the horizon line is. Let’s see how we can use this tool, in combination with Pillow (a fork of the Python Image Library), to automatically recompose any image so it’s level. Step 1: Install the Algorithmia Client While this demo is written using our Python client, our services are equally easy to use in a variety of other programming languages, or even via cURL. Introduction to Color Scheme Extraction - Algorithmia. As an artist, inspiration can come from anywhere: a particular texture, a design, or even a color scheme.
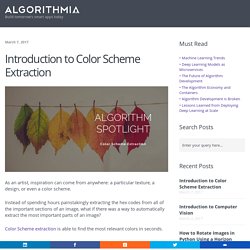
Instead of spending hours painstakingly extracting the hex codes from all of the important sections of an image, what if there was a way to automatically extract the most important parts of an image? Color Scheme extraction is able to find the most relevant colors in seconds. Choosing the right estimator — scikit-learn 0.17 documentation. Bayesian Methods for Hackers. An intro to Bayesian methods and probabilistic programming from a computation/understanding-first, mathematics-second point of view.
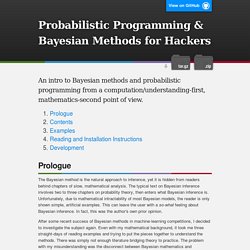
Prologue The Bayesian method is the natural approach to inference, yet it is hidden from readers behind chapters of slow, mathematical analysis. The typical text on Bayesian inference involves two to three chapters on probability theory, then enters what Bayesian inference is. Unfortunately, due to mathematical intractability of most Bayesian models, the reader is only shown simple, artificial examples. This can leave the user with a so-what feeling about Bayesian inference. After some recent success of Bayesian methods in machine-learning competitions, I decided to investigate the subject again. Implementation of k-means Clustering - Edureka. In this blog, you will understand what is K-means clustering and how it can be implemented on the criminal data collected in various US states.
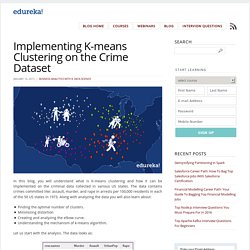
The data contains crimes committed like: assault, murder, and rape in arrests per 100,000 residents in each of the 50 US states in 1973. Along with analyzing the data you will also learn about: Reading and interpreting data. Mining Massive Datasets from Coursera. UT.7.01x: Foundations of Data Analysis from edX. *Note - This is an Archived course* In a world that’s full of data, we have many questions: How long do animals in a shelter have to wait until they are adopted?
Can we model the growth of internet usage in a country? Do films with a more adult rating make more money that other rated films? Luckily, the world is also full of data to help us answer those questions. This course will walk through the basics of statistical thinking – starting with an interesting question. The Open Source Data Science Masters. Machine learning.
Health Data Analytics with Microsoft Excel from Independent. List of Best Data Science and Big Data free online courses/MOOCs. Elements of Statistical Learning: data mining, inference, and prediction. 2nd Edition. Getting and Cleaning Data from Coursera. Data Analyst Nanodegree Program - Udacity. Courses. Cluster Analysis in Data Mining from Coursera. Computing for Data Analysis from Coursera. Computing for Data Analysis is an introduction to the R programming language, but not an introduction to programming.

This course is designed for people who already know how to program. The course description makes it seem like the class is intended for everyone, even those who do not know how to program at all, which Read More Computing for Data Analysis is an introduction to the R programming language, but not an introduction to programming.
This course is designed for people who already know how to program. The course description makes it seem like the class is intended for everyone, even those who do not know how to program at all, which caused a lot of pain in the class forums. Computational Methods for Data Analysis from Coursera. DAT206x: Excel for Data Analysis and Visualization from edX. Microsoft Excel is one of the most widely used solutions for analyzing and visualizing data.
Beginning with Excel 2010, new tools were introduced to enable the analysis of more data, resulting in less time spent creating and maintaining the solutions and enabling a better understanding of what the data means. This better understanding is facilitated by improved visualizations and more sophisticated business logics. Do you want to take your advanced Excel skills to the next level? Excel for Data Analysis and Visualization. This is an Archived Course EdX keeps courses open for enrollment after they end to allow learners to explore content and continue learning. All features and materials may not be all available. Check back often to see when new course start dates are announced.
Microsoft Excel is one of the most widely used solutions for analyzing and visualizing data. Beginning with Excel 2010, new tools were introduced to enable the analysis of more data, resulting in less time spent creating and maintaining the solutions and enabling a better understanding of what the data means. Do you want to take your advanced Excel skills to the next level? Check out this practical new course, taught in short, lecture-based videos, complete with demos, quizzes, and hands-on labs, and skill up on many of the built-in business intelligence (BI) tools and features in Excel. Courses. Exploratory Data Analysis from Coursera. The first 2 weeks of the course provide a thorough overview of plotting in R using the base graphical package, the lattice package and the ggplot2 package.
Week 3 takes a sudden detour into data clustering and the fairly advanced topics of principal components analysis and single value decomposition only jump back to p Read More The first 2 weeks of the course provide a thorough overview of plotting in R using the base graphical package, the lattice package and the ggplot2 package.
Week 3 takes a sudden detour into data clustering and the fairly advanced topics of principal components analysis and single value decomposition only jump back to plotting with a section on color. The clustering section seems a little about of place since there is not any introduction explaining the purpose of clustering. Getting Started With Processing. Processing is a language for visualization.
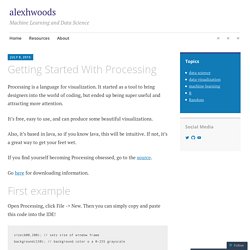
It started as a tool to bring designers into the world of coding, but ended up being super useful and attracting more attention. It’s free, easy to use, and can produce some beautiful visualizations. Also, it’s based in Java, so if you know Java, this will be intuitive. If not, it’s a great way to get your feet wet. If you find yourself becoming Processing obsessed, go to the source. Go here for downloading information. Open Processing, click File -> New. Size(600,200); // sets size of window frame background(150); // background color o a 0-255 grayscale stroke(#0BE2FF); // color of borders strokeWeight(15); // size of the borders point (100,100); // the coordinates of the points. point (150,100); point (200,100); point (250,100); point (300,100); point (350,100); point (400,100); point (450,100); point (500,100); Really simple.
The ellipse function is used to make a circle. Again, pretty simple. Introduction to Big Data Analytics from Coursera. Data Analysis for Advanced Science Projects. Please ensure you have JavaScript enabled in your browser. If you leave JavaScript disabled, you will only access a portion of the content we are providing. <a href="/science-fair-projects/javascript_help.php">Here's how. Data Analysis from Coursera. View this course as a master class in statistics. Jeff Leek is a master statistician; he shows how experts do academic statistical research.
To benefit from this course you should: • Know about statistics beyond the basics • Be familiar with the process of doing academic research • Be able to write research reports Read More View this course as a master class in statistics. Data Analysis Guides - Qualtrics. Data Analysis Tools from Coursera. Do you want to answer questions with data? Interested in discovering simple methods for answering these questions?
Hypothesis testing is the tool for you! After completing this course, you will be able to: - identify the right statistical test for the questions you are asking - apply and carry out hypothesis tests - generalize the results from samples to larger populations - use Analysis of Variance, Chi-Square, Test of Independence and Pearson correlation - present your findings using statistical language. Hypothesis Testing and ANOVAThis session starts where the Data Management and Visualization course left off. Now that you have selected a data set and research question, managed your variables of interest and visualized their relationship graphically, we are ready to test those relationships statistically.
Core Concepts in Data Analysis from Coursera. I'm dropping this course after 5 weeks. Learn Data Science by nborwankar. Reporting, Analytics, and Big Data: A Continuous Feedback Loop to Drive Better Decision-Making. The Data Scientist’s Toolbox from Coursera. DAT204x: Introduction to R Programming from edX. Statistical Inference from Coursera. Regression Models from Coursera. Lecture 1: What is Machine Learning? DAT203x: Data Science and Machine Learning Essentials from edX. 6.00.2x: Introduction to Computational Thinking and Data Science. Predictive Modeling Fundamentals I. Predictive analytics in one hour - a no-nonsense guide - Smart Vision - Europe. Online Training: Introduction to Graph Databases and Neo4j.
This online tutorial helps you build a good starting knowledge of graph databases. It also teaches the core functionality of the Neo4j graph database. You will learn practically how to read and write Cypher queries to work with Neo4j. Prerequisites You don’t need any previous experience with Neo4j, NoSQL databases or specific development languages. Audience. Data Visualization from Coursera. ISE101x: Knowledge Management and Big Data in Business from edX. I really enjoyed this MOOC. I have been a knowledge management consultant for more than 20 years, so I was drawn to it initially because I wanted to see how it would cover the subject. During the early weeks I re-visited much that I already knew, but as it progressed, it became progressively more interesting and Read More I really enjoyed this MOOC. I have been a knowledge management consultant for more than 20 years, so I was drawn to it initially because I wanted to see how it would cover the subject.
During the early weeks I re-visited much that I already knew, but as it progressed, it became progressively more interesting and exciting. For me the most valuable topic was Week 6, Big Data. From a wider perspective, if you want to understand the whole Knowledge Management enchilada, (knowledge and the techniques, tools and processes for its management), the Cloud and our Big Data future, there is no better place to start.