
District Data Labs - How to Transition from Excel to R. How to Transition from Excel to R An Intro to R for Microsoft Excel Users Tony Ojeda In today's increasingly data-driven world, business people are constantly talking about how they want more powerful and flexible analytical tools, but are usually intimidated by the programming knowledge these tools require and the learning curve they must overcome just to be able to reproduce what they already know how to do in the programs they've become accustomed to using.
For most business people, the go-to tool for doing anything analytical is Microsoft Excel. Tm.pdf. Membership. Gain unlimited access to visualization courses and tutorials for insight and presentation.
Learn the process of visualizing data. Anyone can make a chart. Load a dataset into some spreadsheet software, and there you go. But not everyone can make great charts that are readable, usable, and beautiful. How do you get from boring defaults to insightful data graphics? List of amazing talks from New York R Conference 2015.
Analyzing US Census Data with R - R-ladies (San Francisco, CA) Recommendation System in R. Recommender systems are used to predict the best products to offer to customers.
These babies have become extremely popular in virtually every single industry, helping customers find products they'll like. Most people are familiar with the idea, but nearly everyone is exposed to several forms of personalized offers and recommendations each day (Google search ads being among the biggest source). Building recommendation systems is part science, part art, and many have become extremely sophisticated. Such a system might seem daunting for those uninitiated, but it's actually fairly straight forward to get started if you're using the right tools.
This is a post about building recommender systems in R. UPDATE: We used the beer / product recommender for a talk at PyData Boston in July. Beer Dataset "Respect Beer. " - BeerAdvocate.com For this example, we'll use data from Beer Advocate, a community of beer enthusiasts and industry professionals dedicated to supporting and promoting beer. Read Excel files from R. Many people still save their data into Microsoft Excel files.
This is an unhappy choice for many reasons but many was already written about this topic. Furthermore, unfortunately Excel become a de facto standard in many business environment and this routine seems to be difficult to strike out. Many solutions have been implemented to read Excel files from R: each one has advantages and disadvantages, so an universal solution is not available.
Get an overview of all the solutions, allows the choice of the best solution case-by-case. Save Excel files into text Saving Excel files into CSV can be done directly from Excel or through some external tools that allows batch operations. Df = read.table("myfile.csv", header = TRUE) Recommendation System in R. R Tutorial on Reading and Importing Excel Files into R. As most of you know, Excel is a spreadsheet application developed by Microsoft.
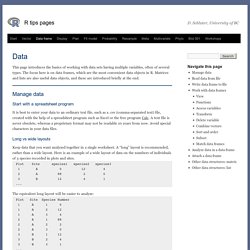
It is an easy accessible tool for organizing, analyzing and storing data in tables and has a widespread use in many different application fields all over the world. Comprehensive guide for Data Exploration in R. Introduction to R. R Learning Module: Subsetting Data. R Learning Module Subsetting Data Version info: Code for this page was tested in R version 3.0.2 (2013-09-25) On: 2013-11-19 With: lattice 0.20-24; foreign 0.8-57; knitr 1.5 1.
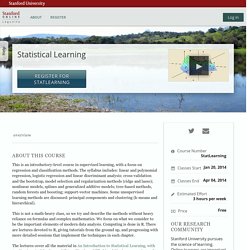
Subsetting variables To manipulate data frames in R we can use the bracket notation to access the indices for the observations and the variables. It is easiest to think of the data frame as a rectangle of data where the rows are the observations and the columns are the variables. Hsb2.small <- read.csv(" # using the names function to see names of the variables and which column of# data to which they correspondnames(hsb2.small) Twotorials by anthony damico. Cookbook for R. R tips pages. This page introduces the basics of working with data sets having multiple variables, often of several types.
Producing Simple Graphs with R. Statistical Learning. About This Course This is an introductory-level course in supervised learning, with a focus on regression and classification methods.
The syllabus includes: linear and polynomial regression, logistic regression and linear discriminant analysis; cross-validation and the bootstrap, model selection and regularization methods (ridge and lasso); nonlinear models, splines and generalized additive models; tree-based methods, random forests and boosting; support-vector machines. Some unsupervised learning methods are discussed: principal components and clustering (k-means and hierarchical). This is not a math-heavy class, so we try and describe the methods without heavy reliance on formulas and complex mathematics. We focus on what we consider to be the important elements of modern data analysis. Statistical Learning. Statistical Learning. R tips pages. 6-advancedmanipulation.pdf. Text Data Mining with Twitter and R. Twitter is a favorite source of text data for analysis: it’s popular (there is a huge volume of variety on all topics) and easily accessible using Twitter’s free, open APIs which are easily consumable in JSON and ATOM formats.
Some people have used Twitter for sophisticated analysis such as predicting flu outbreaks and the stock market, but let’s start with something simpler and less ambitious: an introduction to text data mining using Twitter and R. We’ll download live data using the Twitter APIs, parse it, build a corpus, demonstrate some basic text processing, and plot a hierarchical agglomerative cluster—because everyone likes pictures. I query for a controversial topic, abortion, in hopes of visualizing the two sides of the debate.
There is a specialized package for R called twitteR, but it isn’t available for Windows, but it’s easy to substitute the generic XML package and the Twitter search API documentation for our needs. Starting data analysis/wrangling with R: Things I wish I'd been told. October 14, 2014, [MD] R is a very powerful open source environment for data analysis, statistics and graphing, with thousands of packages available.
After my previous blog post about likert-scales and metadata in R, a few of my colleagues mentioned that they were learning R through a Coursera course on data analysis. I have been working quite intensively with R for the last half year, and thought I'd try to document and share a few tricks, and things I wish I'd have known when I started out. I don't pretend to be a statistics whiz – I don't have a strong background in math, and much of my training in statistics was of the social science "click here, then here in SPSS" kind, using flowcharts to divine which tests to run, given the kinds of variables you wanted to compare.
I'm eager to learn more, but the fact is that running complex statistical functions in R is typically quite easy. So here are some of my suggestions and "lessons learnt", in no particular order. Load(file="db.RData") Cookbook for R » Cookbook for R. Performing SQL queries within R using sqldf package. Make R speak SQL with sqldf. The R community is unique as programming communities go.
Many users of R come from academia and have a relatively extensive mathematical background. The R community has developed in relative isolation from some other areas of programming that have been widely adopted by business. 60+ R resources to improve your data skills. This list was originally published as part of the Computerworld Beginner's Guide to R but has since been expanded to also include resources for advanced beginner and intermediate users. If you're just starting out with R, I recommend first heading to the Beginner's Guide.
These websites, videos, blogs, social media/communities, software and books/ebooks can help you do more with R; my favorites are listed in bold. Want to see a sortable list of resources by subject and type? Expand the chart below. You can also search for key terms within the chart by using the search box below. 60+ R resources to improve your data skills. 60+ R resources to improve your data skills. Performing SQL queries within R using sqldf package. Business Intelligence and Agile Development: Statistical Analysis with R and Microsoft SQL Server 2012. It’s been awhile since I’ve written a blog post, but that doesn’t mean that I haven’t been thinking about things to write about and discuss here. Recently, I had the opportunity to attend an alpha delivery of EMCs “Data Science and Big Data Analytics” course (Read about the course on EMC Education Services site here: ) and was really taken by a couple of points that the course brought home: 1) There’s much more to statistical analysis than I had ever thought about.
(Being a Microsoft SQL Server and Microsoft BI Stack kinda guy, I always figured that you needed Excel and SSAS to do real statistical analysis. 2) Big Data Analytics is a really cool technology discipline! The course itself was based on the EMC Greenplum Database (Community Edition, which you can download and use for free!) While it’s true that my role at EMC means that I focus more on the non-Microsoft stack these days, that doesn’t stop me from thinking about how I can apply things that I lean to the Microsoft platform. Getting Genetics Done: Use SQL queries to manipulate data frames in R with sqldf package.
I've covered a few topics in the past including the plyr package, which is kind of like "GROUP BY" for R, and the merge function for merging datasets. I only recently found the sqldf package for R, and it's already one of the most useful packages I've ever installed. The main function in the package is sqldf(), which takes a quoted string as an argument. You can treat data frames as tables as if they were in a relational database. Impatient R. Translations français: Translated by Kate Bondareva. Serbo-Croatian: Translated by Jovana Milutinovich from Geeks Education. Preface This is a tutorial (previously known as “Some hints for the R beginner”) for beginning to learn the R programming language.
It is a tree of pages — move through the pages in whatever way best suits your style of learning. You are probably impatient to learn R — most people are. This page has several sections, they can be put into the four categories: General, Objects, Actions, Help. Translating between R and SQL: the basics.
An introductory comparison of using the two languages. Background. Make R speak SQL with sqldf. Shiny - Gallery. DataTXT add-on for Google Spreadsheet , enhance textual spreadsheets has never been so easy. A tutorial on object oriented programming in R - Quant Lego. This tutorial gives a brief introduction on object oriented programming in R, covering both S3, S4, reference (R5), and R6 classes. 1 S3 Classes 1.1 The basic idea 1.1.1 Class attribute Everything in R is treated as an object, and one common attribute associated with an object is its class.
A class attribute is a character vector giving the names of the classes from which the object inherits. You can set the class attribute of an object using the class() function. Sql server - RODBC odbcDriverConnect() Connection Error.