
Dyslexia. Prezi. LinkClick. Music. For teachers by teachers. Voices from the iTDi Community 2 – Victor Hugo. Victor Hugo Rojas B. is a teacher trainer and educator with more than 26 years of experience.
He is associate professor of the Didactics of TEFL at U.N.E. He currently lives and works in Lima, Peru. He is passionate about language teacher training and development, and learning technologies. He believes, fervently so, that teachers must be trained through teaching practice, facing challenges, and creating new methodologies. He is the founder of PETsNet. What are you passionate about, Victor Hugo? I am really an ambitious and critical educator who tries to be outstanding. I am also passionate about integrating technologies in teacher training and teacher development courses. How and why did you become a teacher? I think that I am a born teacher. When I was a child and teenager, I used to play teacher with my brother, sister and cousins. What are you most interested in right now, Victor Hugo?
What things do you do to help you get better at being a teacher?
Search 1. Google Image Slideshow - Online Slideshows from Search Results. Tracking the Way We Use Language / Interest. Reading. The Magic Key - Adventures. Good News Network. Teaching. Not All Bad Ideas Are Created Equal. Some say ideas are everything.
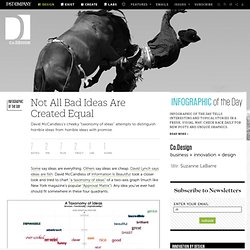
Others say ideas are cheap. David Lynch says ideas are fish. David McCandless of Information Is Beautiful took a closer look and tried to chart "a taxonomy of ideas" of a two-axis graph (much like New York magazine’s popular "Approval Matrix"). Any idea you’ve ever had should fit somewhere in these four quadrants. The upper right zone is the promised land, the intersection of "functional" and "well-structured" ideas where everything from "genius" to "interesting" lies.
What the chart doesn’t capture, of course, is that ideas are motile, evolving creatures. McCandless’s chart is a work in progress, an idea itself. [via Information Is Beautiful; top image: Margo Harrison/Shutterstock]
Getting started. Visualization. Visual Dictionaries. Visual Thesauruses. Lexipedia - Where words have meaning. Free Visual English Dictionary and Thesaurus. VocabGrabber. Graphic Organizers.
Visual root: Mind maps of the pimped out variety. How to Make an Interactive Network Visualization. Networks!
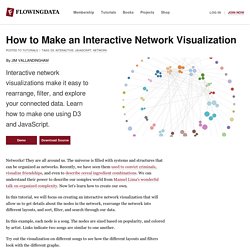
They are all around us. The universe is filled with systems and structures that can be organized as networks. Recently, we have seen them used to convict criminals, visualize friendships, and even to describe cereal ingredient combinations. We can understand their power to describe our complex world from Manuel Lima's wonderful talk on organized complexity. Now let's learn how to create our own. In this tutorial, we will focus on creating an interactive network visualization that will allow us to get details about the nodes in the network, rearrange the network into different layouts, and sort, filter, and search through our data. In this example, each node is a song. Try out the visualization on different songs to see how the different layouts and filters look with the different graphs. Technology This visualization is a JavaScript based web application written using the powerful D3 visualization library. jQuery is also used for some DOM element manipulation.
Functions.