
New R package 'debugr' - use automatic debug messages to improve your code. Cbailiss/pivottabler: Create Pivot Tables natively in R. ModelDown: a website generator for your predictive models – SmarterPoland.pl. I love the pkgdown package.

With a single line of code you can create a complete website with examples, vignettes and documentation for your package. Brilliant! So what about a website generator for predictive models? Imagine that you can take a set of predictive models (generated with caret, mlr, glm, xgboost or randomForest, anything) and automagically generate a website with an exploration/documentation for these models. A documentation with archvist hooks to models, with tables and graphs for model performance explainers, conditional model response explainers or explainers for particular predictions.
Ggraph. Rdrop2 - Dropbox interface from R. Discriptive Statistics. Googlesheets. Grid. An Introduction to the printr Package - Yihui Xie. The printr (read “printer” or “print R”) package is a companion package to knitr.
Its main purpose is to extend the S3 generic function knit_print() in knitr, which is the default value of the chunk option render, as explained in the vignette knit_print.html. To enable the printing methods defined in this package, just library(printr) or loadNamespace('printr') in a code chunk (in the beginning) of your knitr document. Then some objects will be printed differently with what you would have seen in a normal R console. For example: matrices, data frames, and contingency tables are printed as tables (LaTeX, HTML, or Markdown, depending on your output format)the help page (from ? To disable the printing methods in this package, you can call detach('package:printr', unload = TRUE) if you attached the package via library(printr) before, or unloadNamespace('printr') if you loaded it via loadNamespace('printr').
Quick Way of Installing all your old R libraries on a New Device. I recently bought a new laptop and began installing essential software all over again, including R of course!
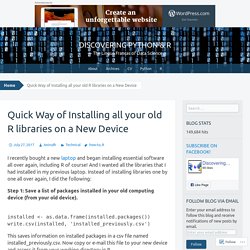
And I wanted all the libraries that I had installed in my previous laptop. Instead of installing libraries one by one all over again, I did the following: Step 1: Save a list of packages installed in your old computing device (from your old device). installed <- as.data.frame(installed.packages()) write.csv(installed, 'installed_previously.csv')
FactomineR - factoextra. Startup. Bookdown. MailR. Shinythemes 1.1.1. If there’s one word that could describe the default styling of Shiny applications, it might be “minimalist.”
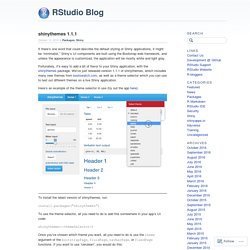
Shiny’s UI components are built using the Bootstrap web framework, and unless the appearance is customized, the application will be mostly white and light gray. Fortunately, it’s easy to add a bit of flavor to your Shiny application, with the shinythemes package. We’ve just released version 1.1.1 of shinythemes, which includes many new themes from bootswatch.com, as well as a theme selector which you can use to test out different themes on a live Shiny application.
Here’s an example of the theme selector in use (try out the app here): To install the latest version of shinythemes, run: install.packages("shinythemes")
rSymPy. Pkgsnap. The magrittr monad – Win-Vector Blog. Posted on Author John MountCategories Computer ScienceTags programming patterns, R Monads are a formal theory of composition where programmers get to invoke some very abstract mathematics (category theory) to argue the minutia of annotating, scheduling, sequencing operations, and side effects.
On the positive side the monad axioms are a guarantee that related ways of writing code are in fact substitutable and equivalent; so you want your supplied libraries to obey such axioms to make your life easy. On the negative side, the theory is complicated.
Caret. Profvis (interactive HTML code profiling) Google trends. Lubridate / anytime / flipTime. Fitting Distributions. SparkR. Showtext. Shinyjs. Ggextra. Radiant. DiagrammeR. HtmlTable. Get data out of excel and into R with readxl. I’m pleased to announced that the first version of readxl is now available on CRAN.
Readxl makes it easy to get tabular data out of excel. It: Supports both the legacy .xls format and the modern xml-based .xlsx format. .xls support is made possible the with libxls C library, which abstracts away many of the complexities of the underlying binary format.
Magrittr 1.5. (Posted on behalf of Stefan Milton Bache) Sometimes it’s the small things that make a big difference.
Rvest: easy web scraping with R. Rvest is new package that makes it easy to scrape (or harvest) data from html web pages, inspired by libraries like beautiful soup.
It is designed to work with magrittr so that you can express complex operations as elegant pipelines composed of simple, easily understood pieces. Install it with: install.packages("rvest") rvest in action. GTrendsR package to Explore Google trending for Field Dependent Terms. (This article was originally published at TRinker's R Blog, and syndicated at StatsBlogs.)
My friend, Steve Simpson, introduced me to Philippe Massicotte and Dirk Eddelbuettel’s GTrendsR GitHub package this week. It’s a pretty nifty wrapper to the Google Trends API that enables one to search phrase trends over time. The trend indices that are given are explained in more detail here: Ever have a toy you know is super cool but don’t know what to use it for yet?
Squash - multivariate visualization package for R. Squash is an add-on package for the R statistical environment.
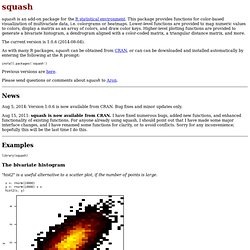
This package provides functions for color-based visualization of multivariate data, i.e. colorgrams or heatmaps. Lower-level functions are provided to map numeric values to colors, display a matrix as an array of colors, and draw color keys. Higher-level plotting functions are provided to generate a bivariate histogram, a dendrogram aligned with a color-coded matrix, a triangular distance matrix, and more. The current version is 1.0.6 (2014-08-04).
RStudio Blog. SjPlot - sjMisc - sjStats. Rgitbook. Mosaic. Package: mosaic Type: Package Title: Project MOSAIC (mosaic-web.org) statistics and mathematics teaching utilities Version: 0.6-2 Date: 2012-09-03 Depends: R (>= 2.10), lattice, grid, methods, survival, Hmisc, utils Suggests: MASS, reshape2, manipulate, vcd, RCurl, testthat Author: Randall Pruim <rpruim@calvin.edu>, Daniel Kaplan <kaplan@macalester.edu>, Nicholas Horton <nhorton@smith.edu> Maintainer: Randall Pruim <rpruim@calvin.edu> Description: Data sets and utilities from Project MOSAIC (mosaic-web.org) used to teach mathematics, statistics, computation and modeling.
Funded by the NSF, Project MOSAIC is a community of educators working to tie together aspects of quantitative work that students in science, technology, engineering and mathematics will need in their professional lives, but which are usually taught in isolation, if at all. Install log. Announcing dtupdate v1.0 - R Package Reporter/Updater for the devtools Universe.
MissMech. WRS - Robust statistics. Today a new version (0.23.1) of the WRS package (Wilcox’ Robust Statistics) has been released. This package is the companion to his rather exhaustive book on robust statistics, “Introduction to Robust Estimation and Hypothesis Testing” (Amazon Link de/us).
Deducer-Quick-Start-Guide. Latex output. XLConnect. PowerBuilder and R get together. The other day I was thinking about writing a blog using PowerBuilder, but couldn't decide which one other technology I should integrate it...of course...R came to my mind... My journey started around 4 days ago...when I start looking for ways to call R from an external language...last time I used Rook and Heroku to call R from SAP Mobile Platform as explained in my blog Consuming R from SAP Mobile Platform, but this time I knew that I needed to do something different. My first thought was to use Rserve which is an R Server used by the SAP HANA Studio to connect to R as explained in my blog When SAP HANA met R - First kiss, so I downloaded the REngine files which are two .jar Java files. In order to connect to Rserve we need to set it up...so basically with the Rserve package installed on my RStudio I simply need to create a small file... When you run this...the R Server will start as a process that can be seen in the Task Manager.
Updating R through a menu-bar: installr. In preparation for the upcoming release of R 3.0.0, a new release 0.9 of installr is now on CRAN. The package can be installed and loaded using: The new version includes various bug fixes (as can be seen in the NEWS file) and new functions and features. The most user visible feature is that from now on, whenever loading installr in the Rgui, it will add a new menu-bar for updating your R version (the menu is removed when the package is detached). When choosing to update R, a new GUI based system will guide you step by step through the updating process.
It will first check if a newer version of R is available, if so, it will offer to show the latest NEWS of that release, download and install the new version, and copy/move your packages from the previous library folder, to the one in the new installation. Installing & Using R on Amazon EC2. If you’re an R user, you’ve surely heard all the hype around ‘big data’ and how R is commonly used to analyze these volumes of data. One thing that’s often missing from the discussion is HOW to work around issues using big data and R, specifically how to deal with the fact that R stores all its objects in-memory. While you can use packages such as ff and bigmemory to overcome the in-memory limits of your local machine, these additional packages do require some re-engineering of your code.
Instead, consider using Amazon EC2 to provision the resources you need. A Guide to Speeding Up R Code. New in forecast 5.0. Last week, version 5.0 of the forecast package for R was released. Fastclust - Fast hierarchical clustering.